Fig. 8
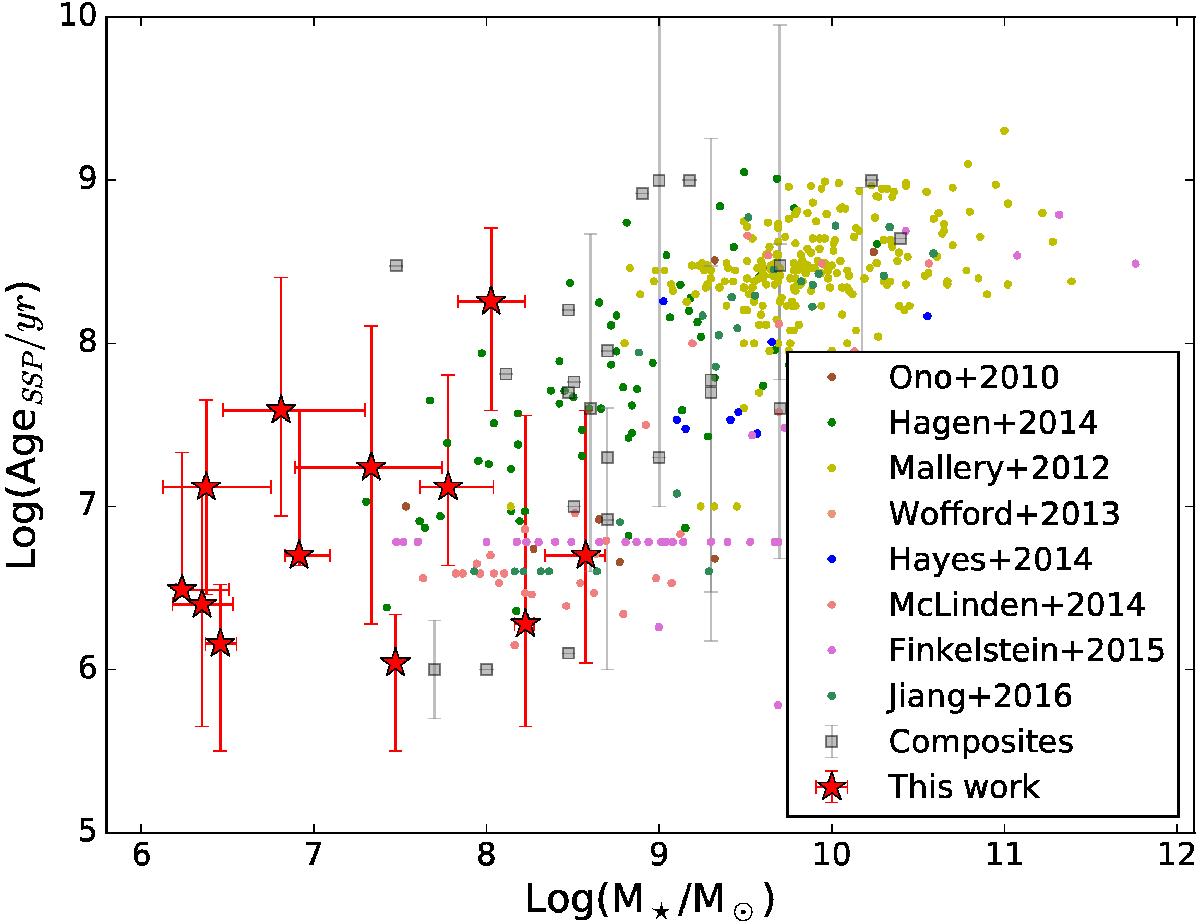
Stellar mass versus the age of the stellar population, as determined by SED-fitting of exponentionally declining star formation histories. The coloured dots correspond to a variety of results from previous spectroscopically-confirmed LAE studies, while the grey squares correspond to the collection of composites assembled by McLinden et al. (2014). For comparison, we also plot a sample of non-LAE, represented by the pink dots (Finkelstein et al. 2015).
Current usage metrics show cumulative count of Article Views (full-text article views including HTML views, PDF and ePub downloads, according to the available data) and Abstracts Views on Vision4Press platform.
Data correspond to usage on the plateform after 2015. The current usage metrics is available 48-96 hours after online publication and is updated daily on week days.
Initial download of the metrics may take a while.