Fig. 5
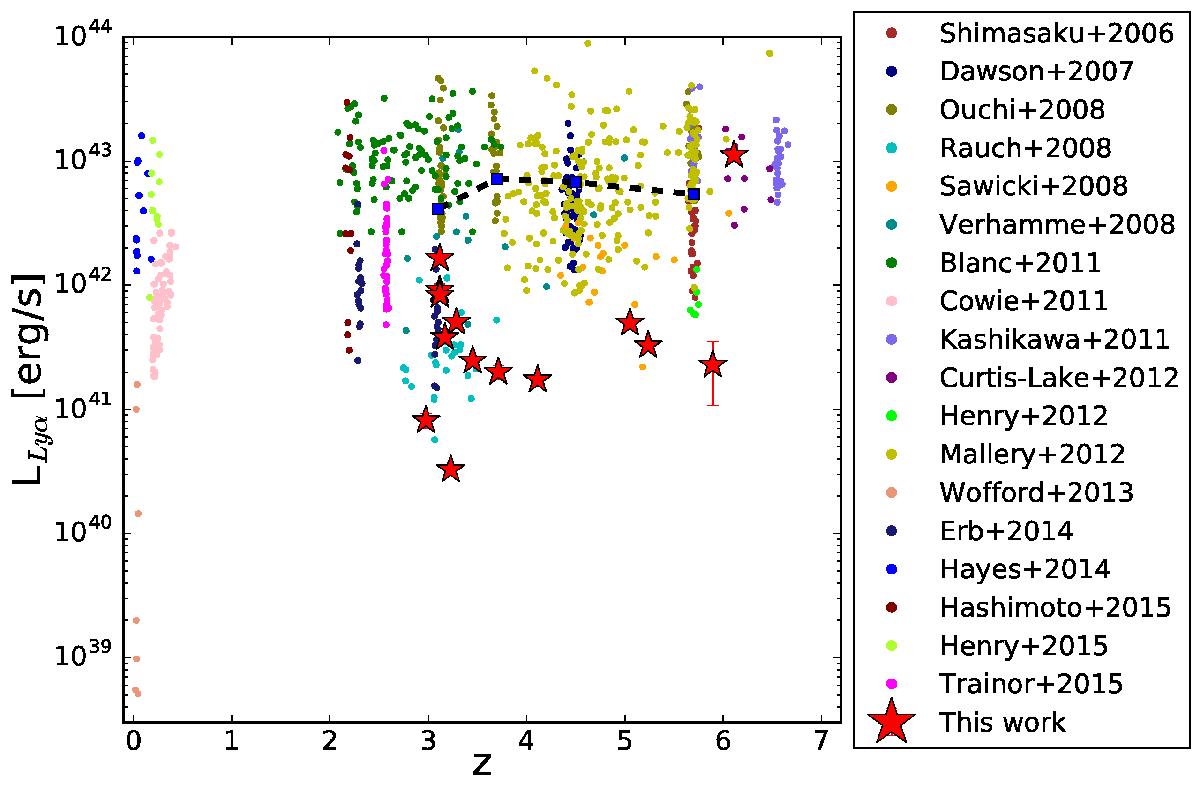
Delensed luminosity of the Lyα line against the redshift of our targets, marked by the red stars. We compare this to previously large samples of spectroscopically-confirmed LAEs in the literature, which are shown by dots of different colours. We overplot the values of L⋆ at various redshifts from Ouchi et al. (2008) with a black dashed line.
Current usage metrics show cumulative count of Article Views (full-text article views including HTML views, PDF and ePub downloads, according to the available data) and Abstracts Views on Vision4Press platform.
Data correspond to usage on the plateform after 2015. The current usage metrics is available 48-96 hours after online publication and is updated daily on week days.
Initial download of the metrics may take a while.