Fig. D.1
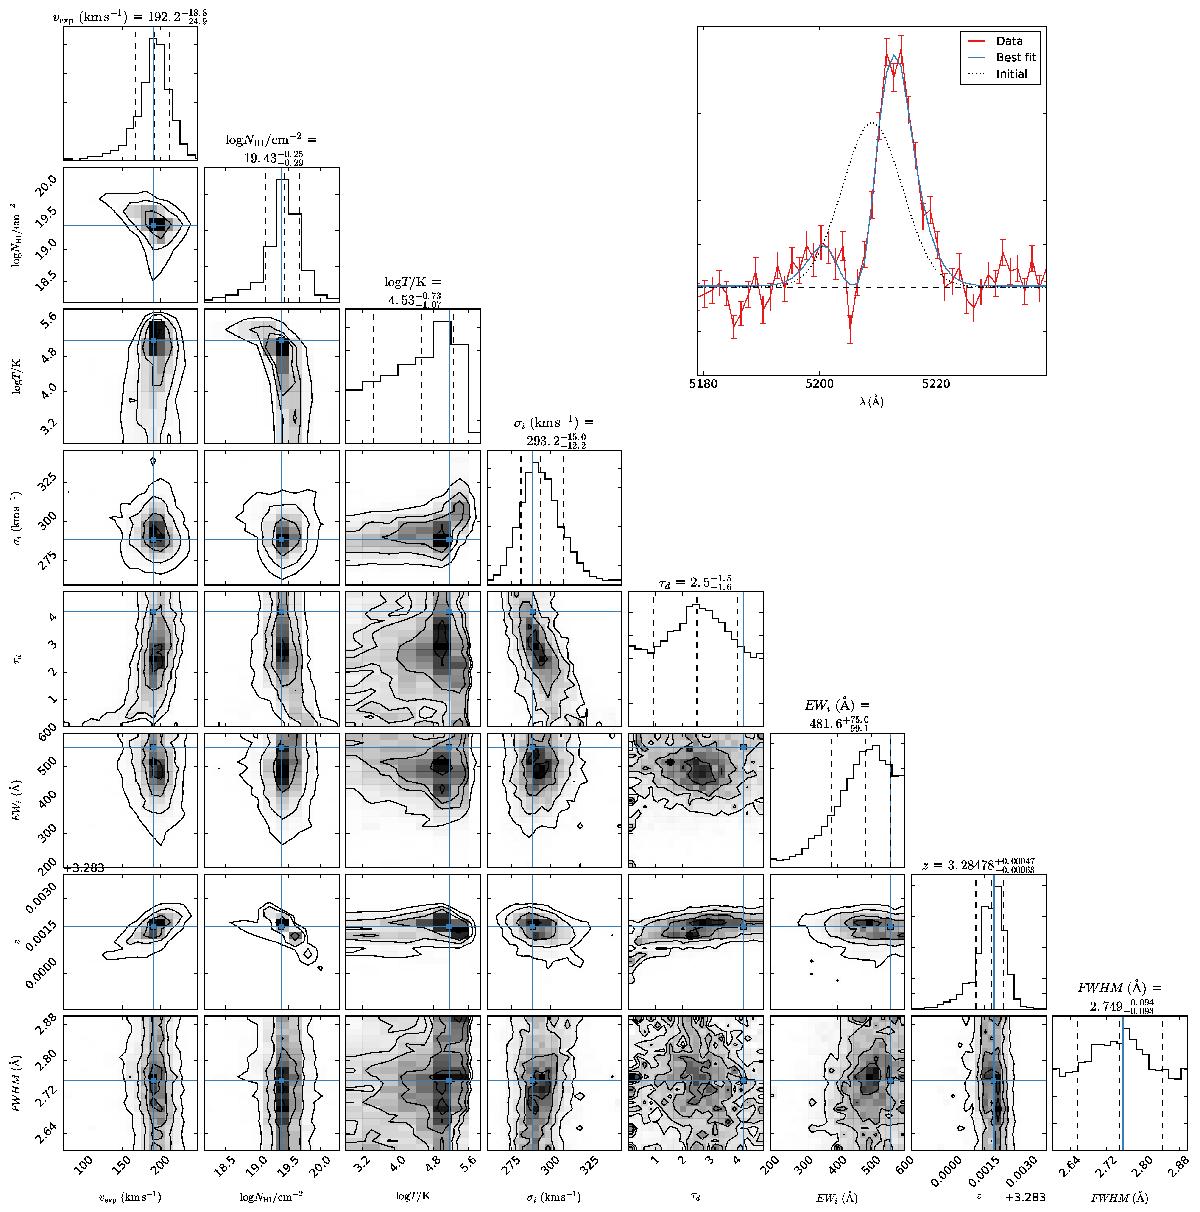
Lya modelling results for LAE NE-94a. We show in the top right panel the spectrum zoomed in on Lyα overplotted with the best-fit model. We show the likelihood of each model parameter against all other model parameters in the other panels. The parameters plotted are (from left/top to right/bottom): expansion velocity (vexp), hydrogen column density (nH), temperature (T), intrinsic spread of velocities (σi), optical depth of dust (τd), intrinsic EW (EWi), the systemic redshift (z), and the FWHM of the observations. The best-fit parameters are indicated by the blue lines in each panel, while the predicted parameter ranges are shown at the top of each column.
Current usage metrics show cumulative count of Article Views (full-text article views including HTML views, PDF and ePub downloads, according to the available data) and Abstracts Views on Vision4Press platform.
Data correspond to usage on the plateform after 2015. The current usage metrics is available 48-96 hours after online publication and is updated daily on week days.
Initial download of the metrics may take a while.