Free Access
Fig. C.4
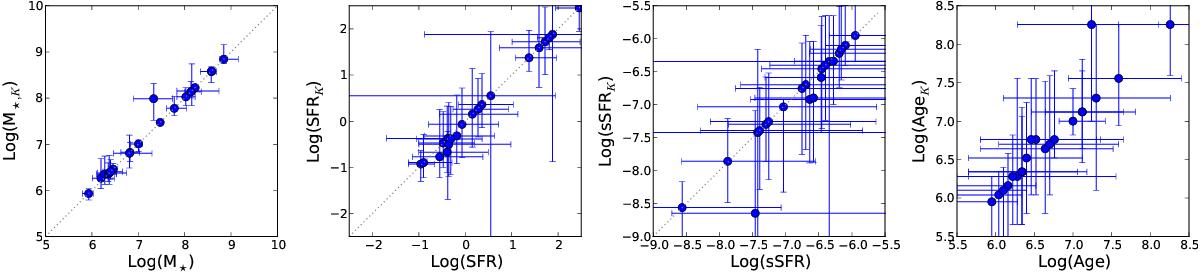
Comparison of the SED-fitting results obtained using the original photometry (x-axis) versus those obtained using a catalogue where mock 3σK-band detections were inserted for non-detections (y-axis). The panels show, from left to right, the stellar mass, the SFR, the sSFR, and stellar age.
Current usage metrics show cumulative count of Article Views (full-text article views including HTML views, PDF and ePub downloads, according to the available data) and Abstracts Views on Vision4Press platform.
Data correspond to usage on the plateform after 2015. The current usage metrics is available 48-96 hours after online publication and is updated daily on week days.
Initial download of the metrics may take a while.