Free Access
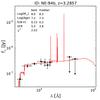
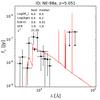
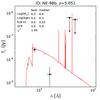
Fig. C.1
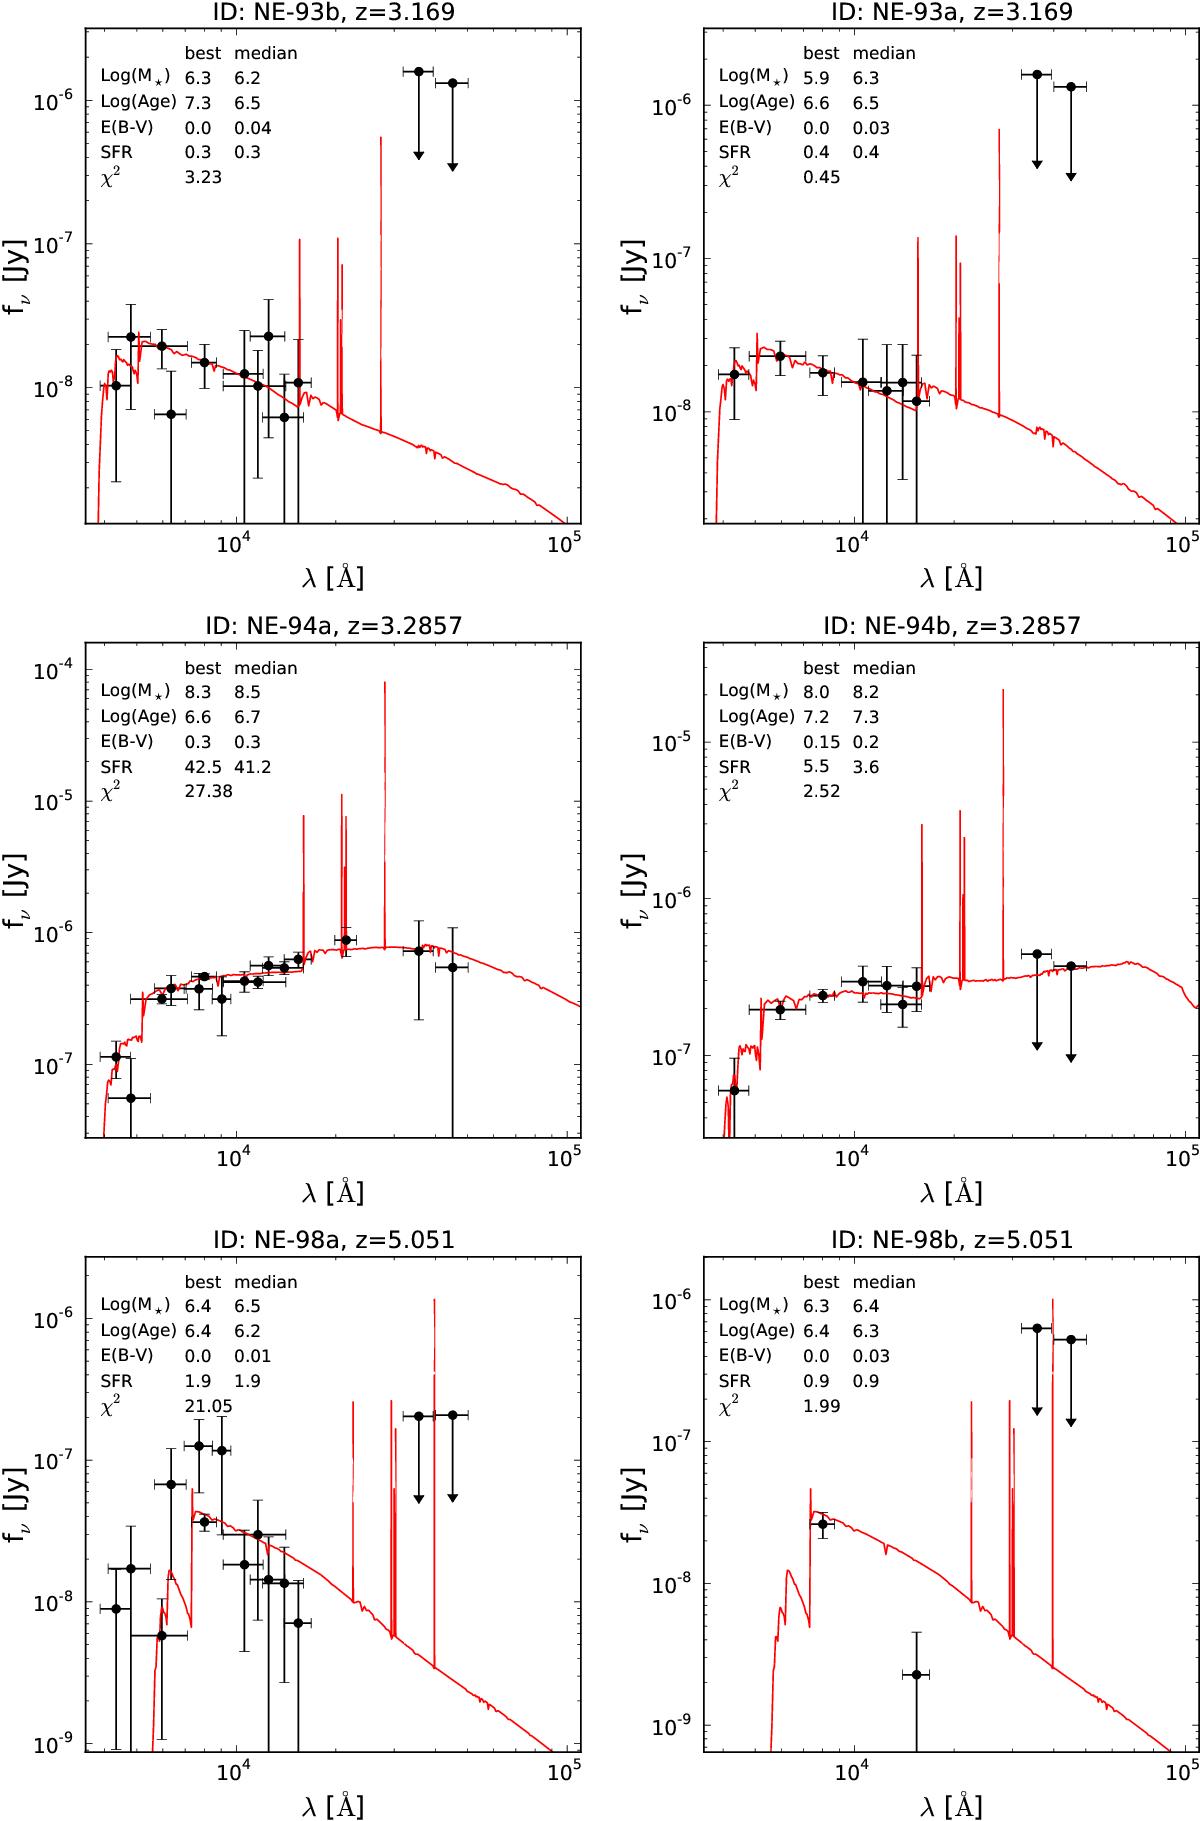
Sed fitting results of individual LAEs. The red lines correspond to the best-fitting SED-model and the black circles are the photometric datapoints with 2σ-errorbars. The details of the best fitting model and the median marginalized values for each galaxy are shown wiht text in the upper left corners.
This figure is made of several images, please see below:
Current usage metrics show cumulative count of Article Views (full-text article views including HTML views, PDF and ePub downloads, according to the available data) and Abstracts Views on Vision4Press platform.
Data correspond to usage on the plateform after 2015. The current usage metrics is available 48-96 hours after online publication and is updated daily on week days.
Initial download of the metrics may take a while.