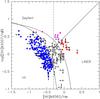
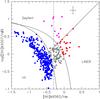
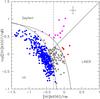
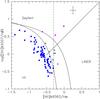
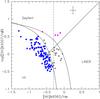
Fig. 7
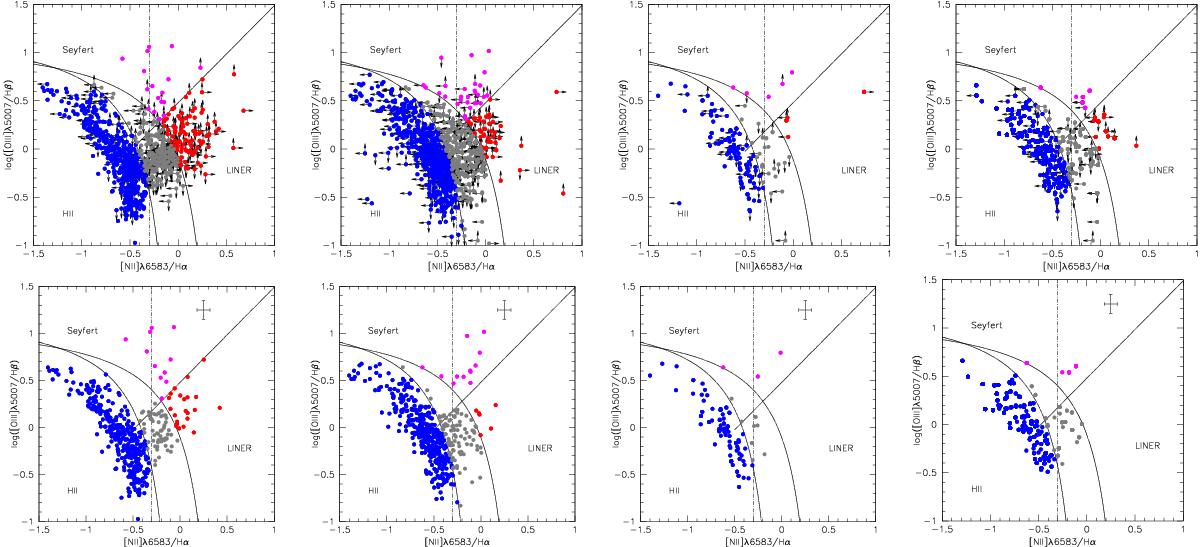
Diagnostic diagrams of [Oiii]λ5007/Hβ vs. [Nii]λ6583/Hα. Leftmost panel: DD for galaxies that are cluster members; second panel from right: same, for w0. The third and fourth panels from right show one realization of w0t,M and of ![]() . Blue, red, and magenta colors identify Hii, LINERs, and Seyferts, respectively. Gray data points identify transition objects. Arrows indicate data points for which upper and/or lower limits to the diagnostic emission line ratios are considered. The bottom rows show panel for detections ordered in the same sequence. Median errors at a 1σ confidence level are shown in the upper right corner of the diagrams with detections only.
. Blue, red, and magenta colors identify Hii, LINERs, and Seyferts, respectively. Gray data points identify transition objects. Arrows indicate data points for which upper and/or lower limits to the diagnostic emission line ratios are considered. The bottom rows show panel for detections ordered in the same sequence. Median errors at a 1σ confidence level are shown in the upper right corner of the diagrams with detections only.
Current usage metrics show cumulative count of Article Views (full-text article views including HTML views, PDF and ePub downloads, according to the available data) and Abstracts Views on Vision4Press platform.
Data correspond to usage on the plateform after 2015. The current usage metrics is available 48-96 hours after online publication and is updated daily on week days.
Initial download of the metrics may take a while.