Fig. 5
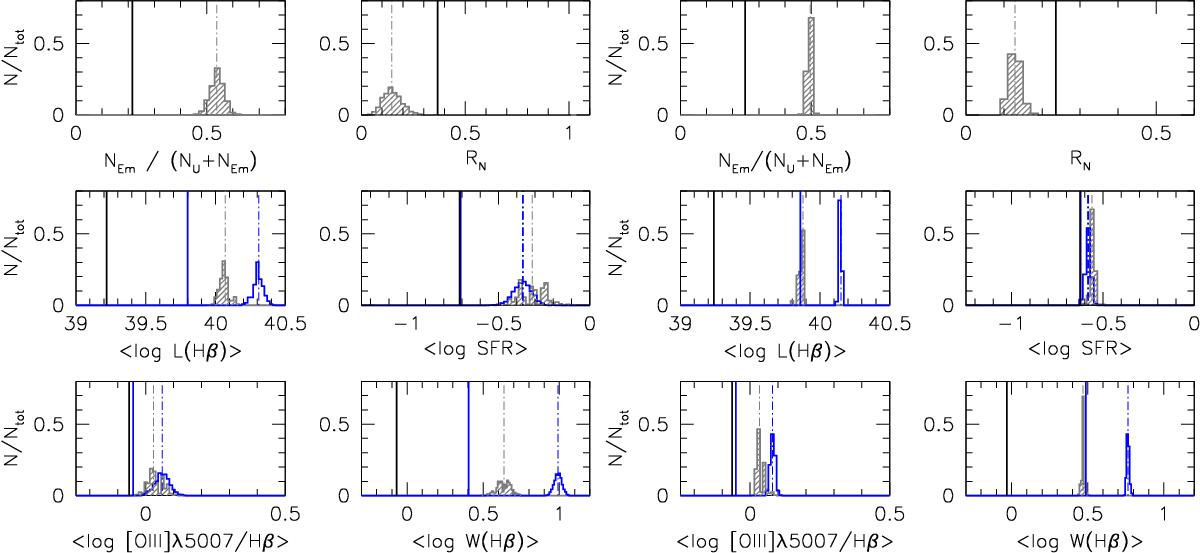
Results of bootstrap simulations. The w1 sample is compared with 1000 virtual w0t,M CSs of ≈350 sources (six leftmost panels), and with 200 virtual ![]() (six rightmost panels). The panels show median values measured for the cluster members (thick solid lines) along with the distributions of the bootstrapped sample w0t,M medians (left) and
(six rightmost panels). The panels show median values measured for the cluster members (thick solid lines) along with the distributions of the bootstrapped sample w0t,M medians (left) and ![]() (right) and their medians (dot-dashed lines). Top: ratio REm (left) and ratio RN (from DD[NII]; right) for the revised classification (gray). The middle panels show the luminosity of Hβ in erg s-1 (left), and the SFR in M⊙ yr-1 (only for Hii sources; right). Blue histograms and lines refer to average values of detections only, gray histogram and lines show medians and include upper limits. Bottom panel: distributions for [Oiii]λ5007/Hβ (left) and W(Hβ) (right), with the same meaning of color coding.
(right) and their medians (dot-dashed lines). Top: ratio REm (left) and ratio RN (from DD[NII]; right) for the revised classification (gray). The middle panels show the luminosity of Hβ in erg s-1 (left), and the SFR in M⊙ yr-1 (only for Hii sources; right). Blue histograms and lines refer to average values of detections only, gray histogram and lines show medians and include upper limits. Bottom panel: distributions for [Oiii]λ5007/Hβ (left) and W(Hβ) (right), with the same meaning of color coding.
Current usage metrics show cumulative count of Article Views (full-text article views including HTML views, PDF and ePub downloads, according to the available data) and Abstracts Views on Vision4Press platform.
Data correspond to usage on the plateform after 2015. The current usage metrics is available 48-96 hours after online publication and is updated daily on week days.
Initial download of the metrics may take a while.