Free Access
Fig. 4
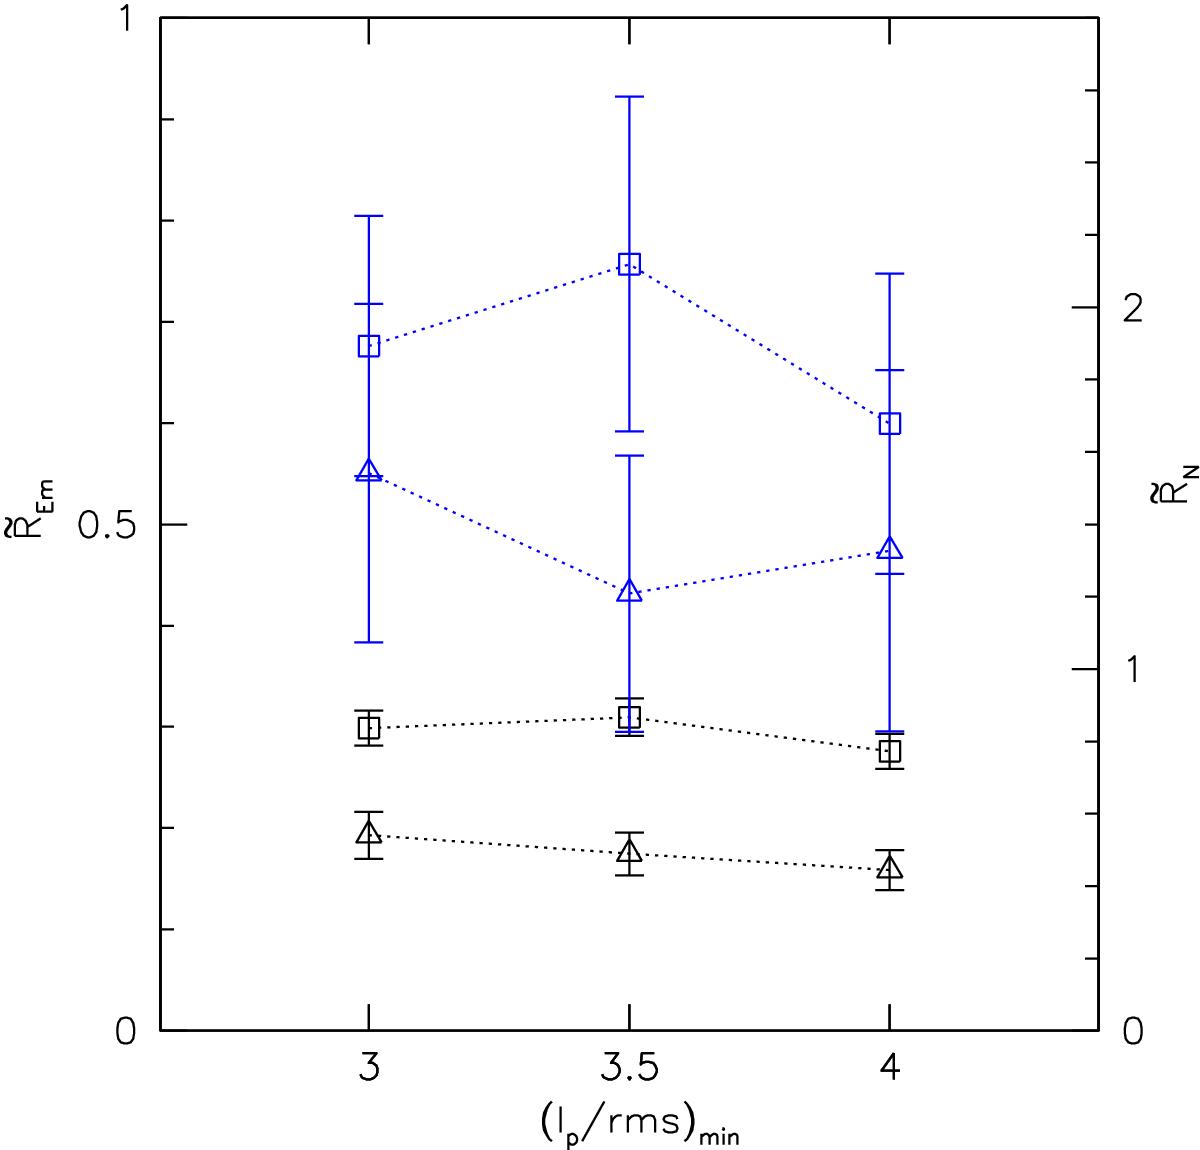
Effect of assumed minimum Ip/rms on fraction of ELGs with respect to CSs. The left ordinate shows the ratio ![]() (black lines; squares and triangles indicate normalization by
(black lines; squares and triangles indicate normalization by ![]() and w0t,M) respectively. The right ordinate shows the ratio
and w0t,M) respectively. The right ordinate shows the ratio ![]() (blue).
(blue).
Current usage metrics show cumulative count of Article Views (full-text article views including HTML views, PDF and ePub downloads, according to the available data) and Abstracts Views on Vision4Press platform.
Data correspond to usage on the plateform after 2015. The current usage metrics is available 48-96 hours after online publication and is updated daily on week days.
Initial download of the metrics may take a while.