Free Access
Fig. 14
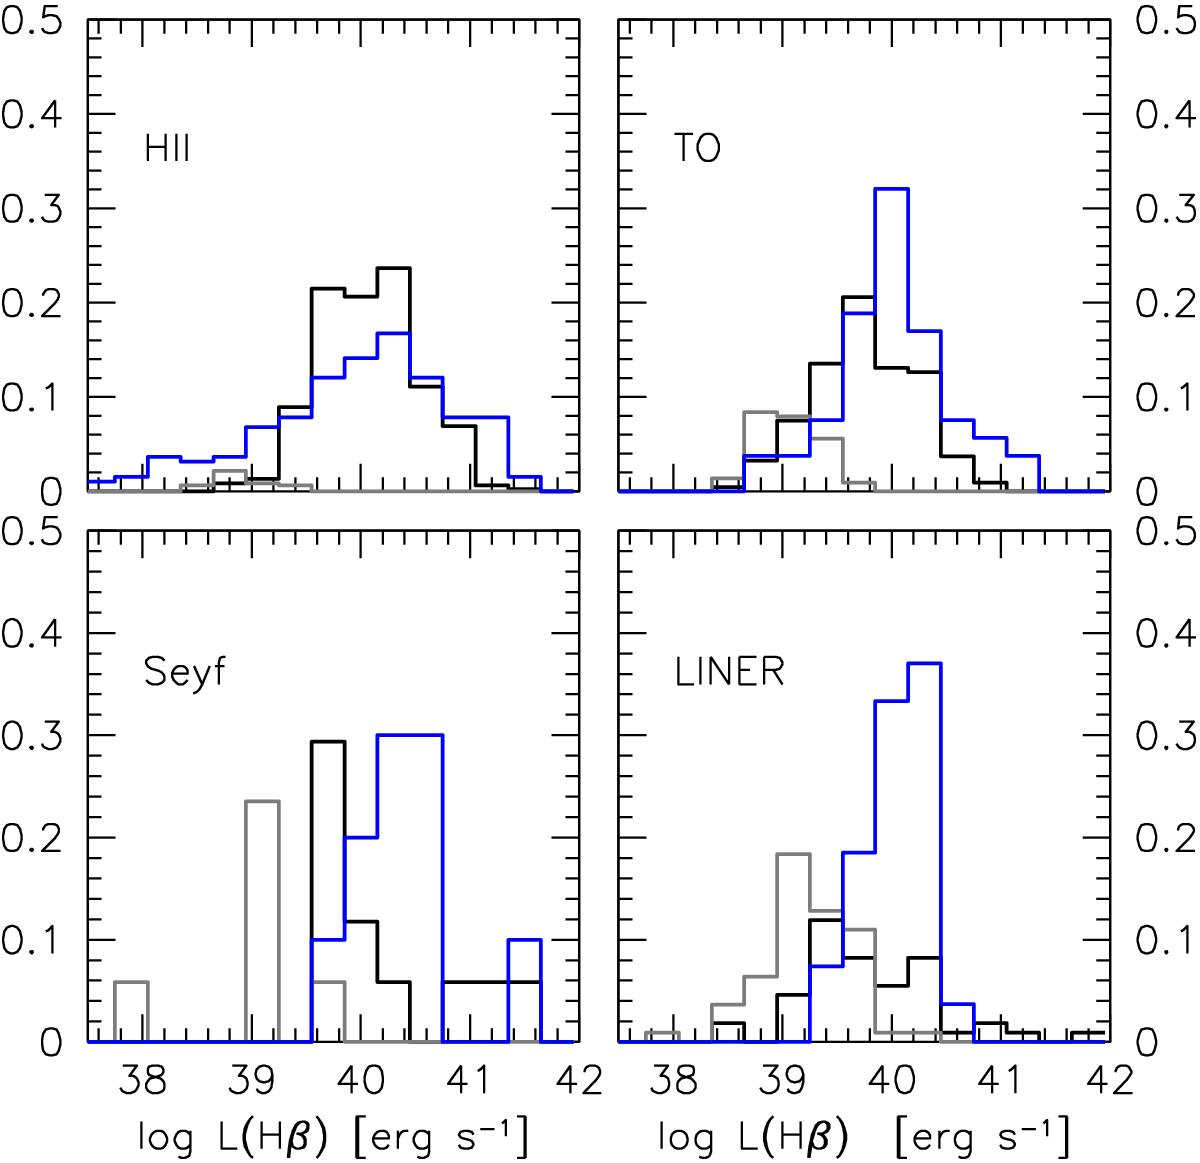
Distribution of L(Hα) for the WINGS sources (w1 sample), for Hii, TOs, Seyferts, and LINERs (black line), and for the sources analyzed by Sabater et al. (2012, blue). Gray lines trace the distribution of upper limits for the w0 sample.Objects classified with censored emission line ratios are included in the histogram.
Current usage metrics show cumulative count of Article Views (full-text article views including HTML views, PDF and ePub downloads, according to the available data) and Abstracts Views on Vision4Press platform.
Data correspond to usage on the plateform after 2015. The current usage metrics is available 48-96 hours after online publication and is updated daily on week days.
Initial download of the metrics may take a while.