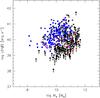
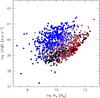
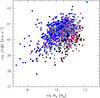
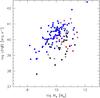
Fig. 12
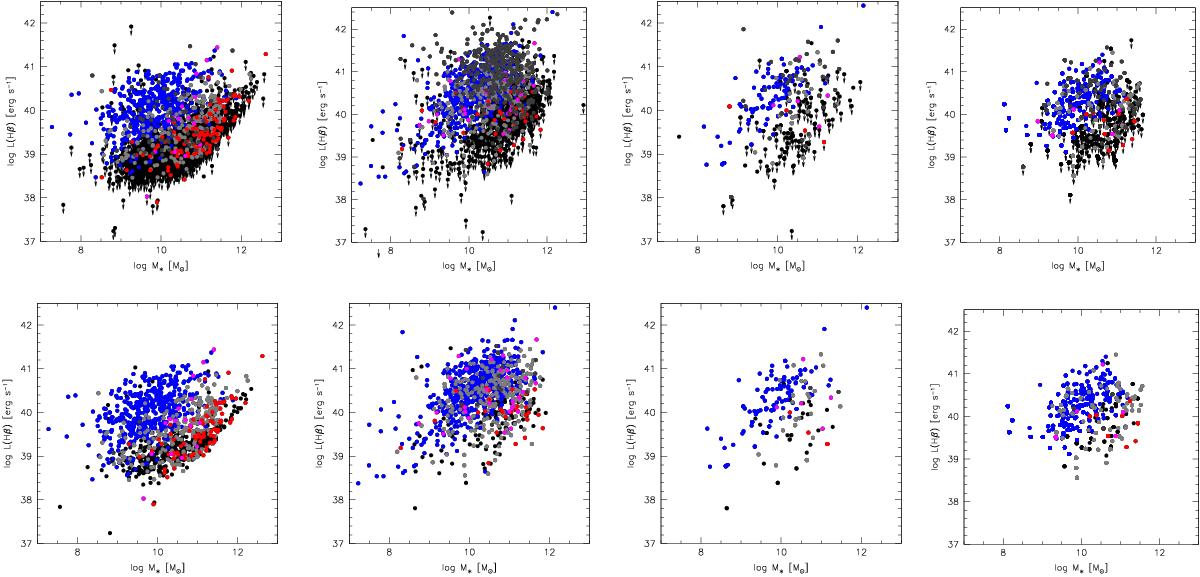
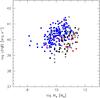
Logarithm of Hβ luminosity in erg s-1 vs. log of stellar mass in solar units for cluster members and non-members (middle and right panels) in the following order from left to right: w1, w0, one realization of w0t,M, and one realization of ![]() . Upper panels include upper limits and detections, and lower panels are for detections only. Sources of different classes are identified by the same color coding as the previous figures.
. Upper panels include upper limits and detections, and lower panels are for detections only. Sources of different classes are identified by the same color coding as the previous figures.
Current usage metrics show cumulative count of Article Views (full-text article views including HTML views, PDF and ePub downloads, according to the available data) and Abstracts Views on Vision4Press platform.
Data correspond to usage on the plateform after 2015. The current usage metrics is available 48-96 hours after online publication and is updated daily on week days.
Initial download of the metrics may take a while.