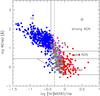
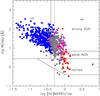
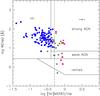
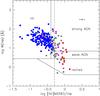
Fig. 11
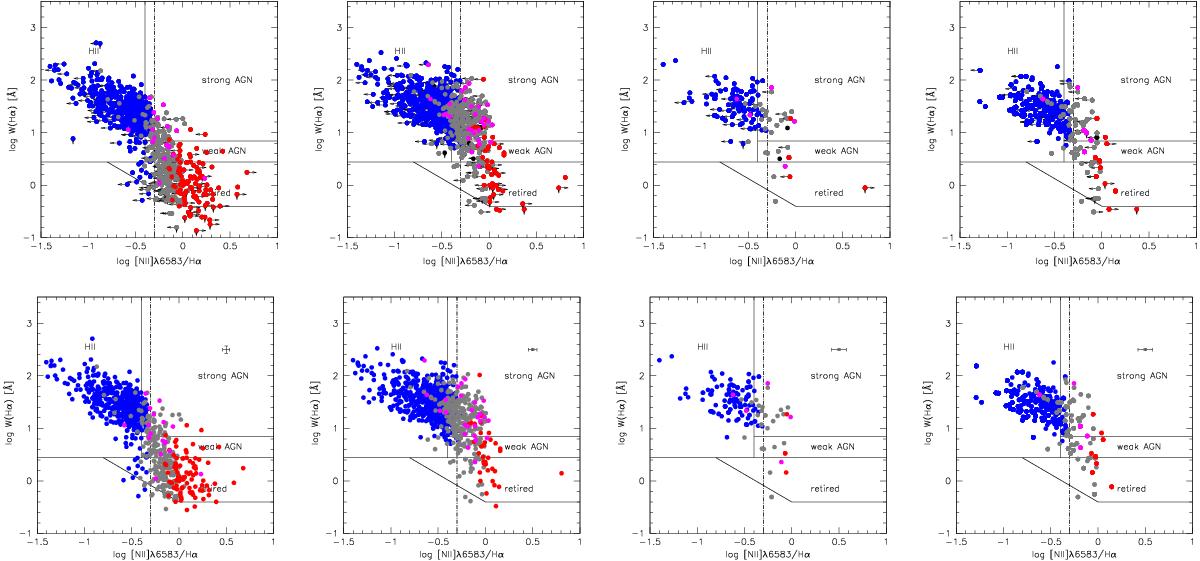
Equivalent width of HαW(Hα) vs. diagnostic ratio [Nii]λ6583/Hα. Upper panels: sources with detections and upper and lower limits. Bottom panels: sources with detection only. Leftmost panel are for sources belonging to clusters, panels on the right are for control sources: w0 (second from left) and one realization of w0t,M and of ![]() . Dividing lines are drawn according to Cid Fernandes et al. (2010), separating Hii, strong AGNs, weak AGNs, and retired galaxies. The dot-dashed line indicates a limiting [Nii]λ6583/Hα ratio for extragalactic nuclear Hii region. Color coding identifies Hii, TO, LINERs, and Seyfert as in the previous figures. Black data points identify ELGs with no entry in DD[NII].
. Dividing lines are drawn according to Cid Fernandes et al. (2010), separating Hii, strong AGNs, weak AGNs, and retired galaxies. The dot-dashed line indicates a limiting [Nii]λ6583/Hα ratio for extragalactic nuclear Hii region. Color coding identifies Hii, TO, LINERs, and Seyfert as in the previous figures. Black data points identify ELGs with no entry in DD[NII].

Current usage metrics show cumulative count of Article Views (full-text article views including HTML views, PDF and ePub downloads, according to the available data) and Abstracts Views on Vision4Press platform.
Data correspond to usage on the plateform after 2015. The current usage metrics is available 48-96 hours after online publication and is updated daily on week days.
Initial download of the metrics may take a while.