Fig. 1
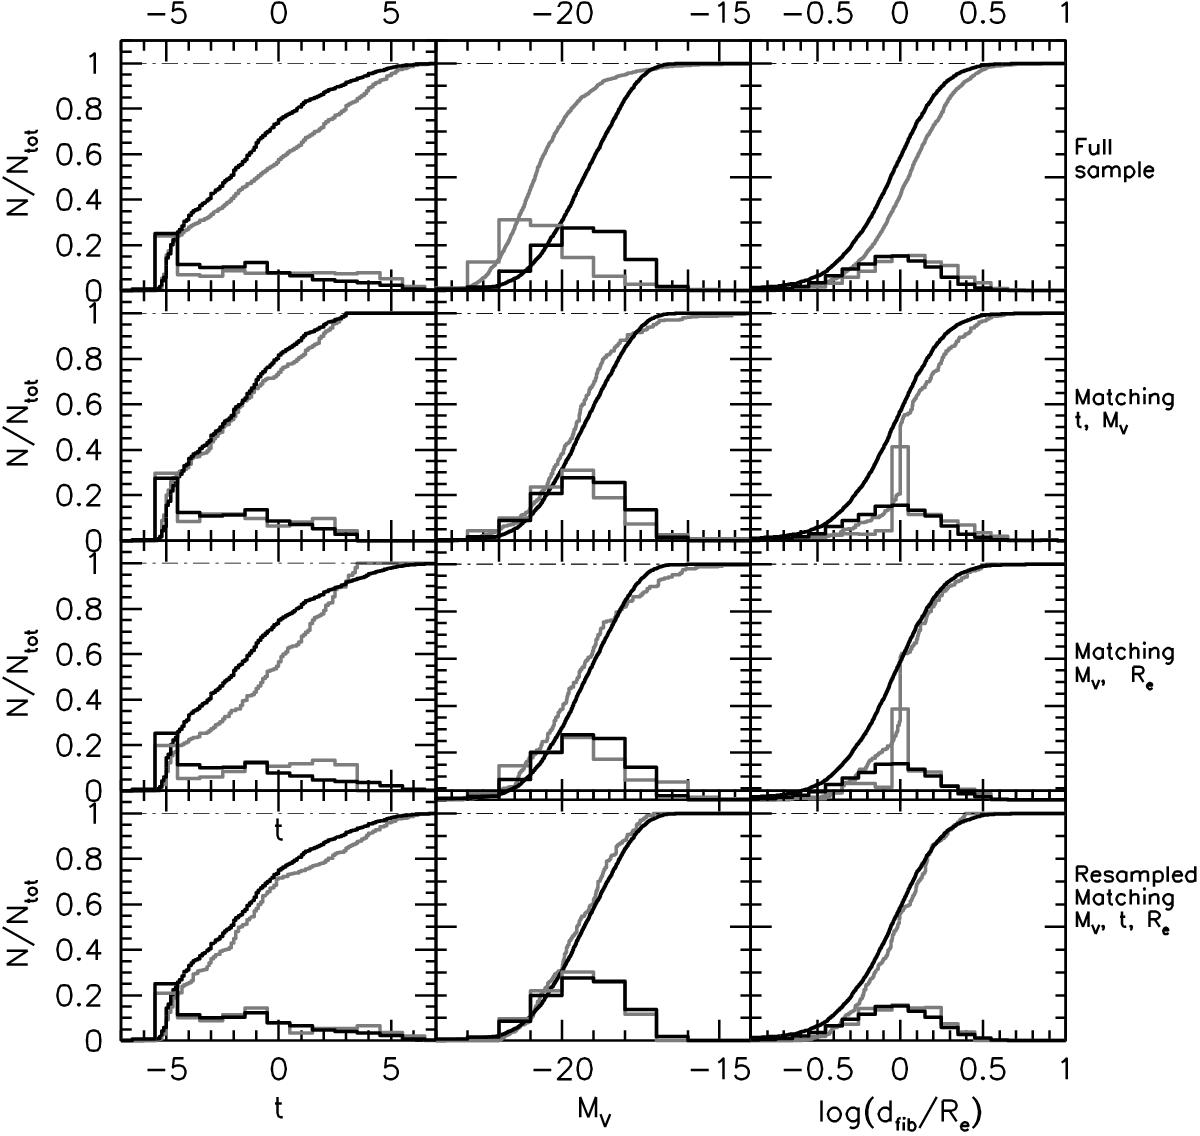
Cumulative and differential distribution of de Vaucouleurs’t (left panel), of MV (middle), and ratio aperture to effective radius log (dfib/Re), for cluster members (black) and non-cluster galaxies (gray). Top row of panels: all cluster and non-cluster galaxies included in the present study (i.e., w1 and w0 samples); second row of panels from top: cluster member vs. CS with matched distributions of MV and de Vaucouleurs’ t (w0t,M); third row from top: cluster member vs. CS with matched distributions of Re and de Vaucouleurs’ t (w0t,Re). Bottom row: resampled CS matching MV, t, and Re(![]() ).
).
Current usage metrics show cumulative count of Article Views (full-text article views including HTML views, PDF and ePub downloads, according to the available data) and Abstracts Views on Vision4Press platform.
Data correspond to usage on the plateform after 2015. The current usage metrics is available 48-96 hours after online publication and is updated daily on week days.
Initial download of the metrics may take a while.