Free Access
Fig. 3
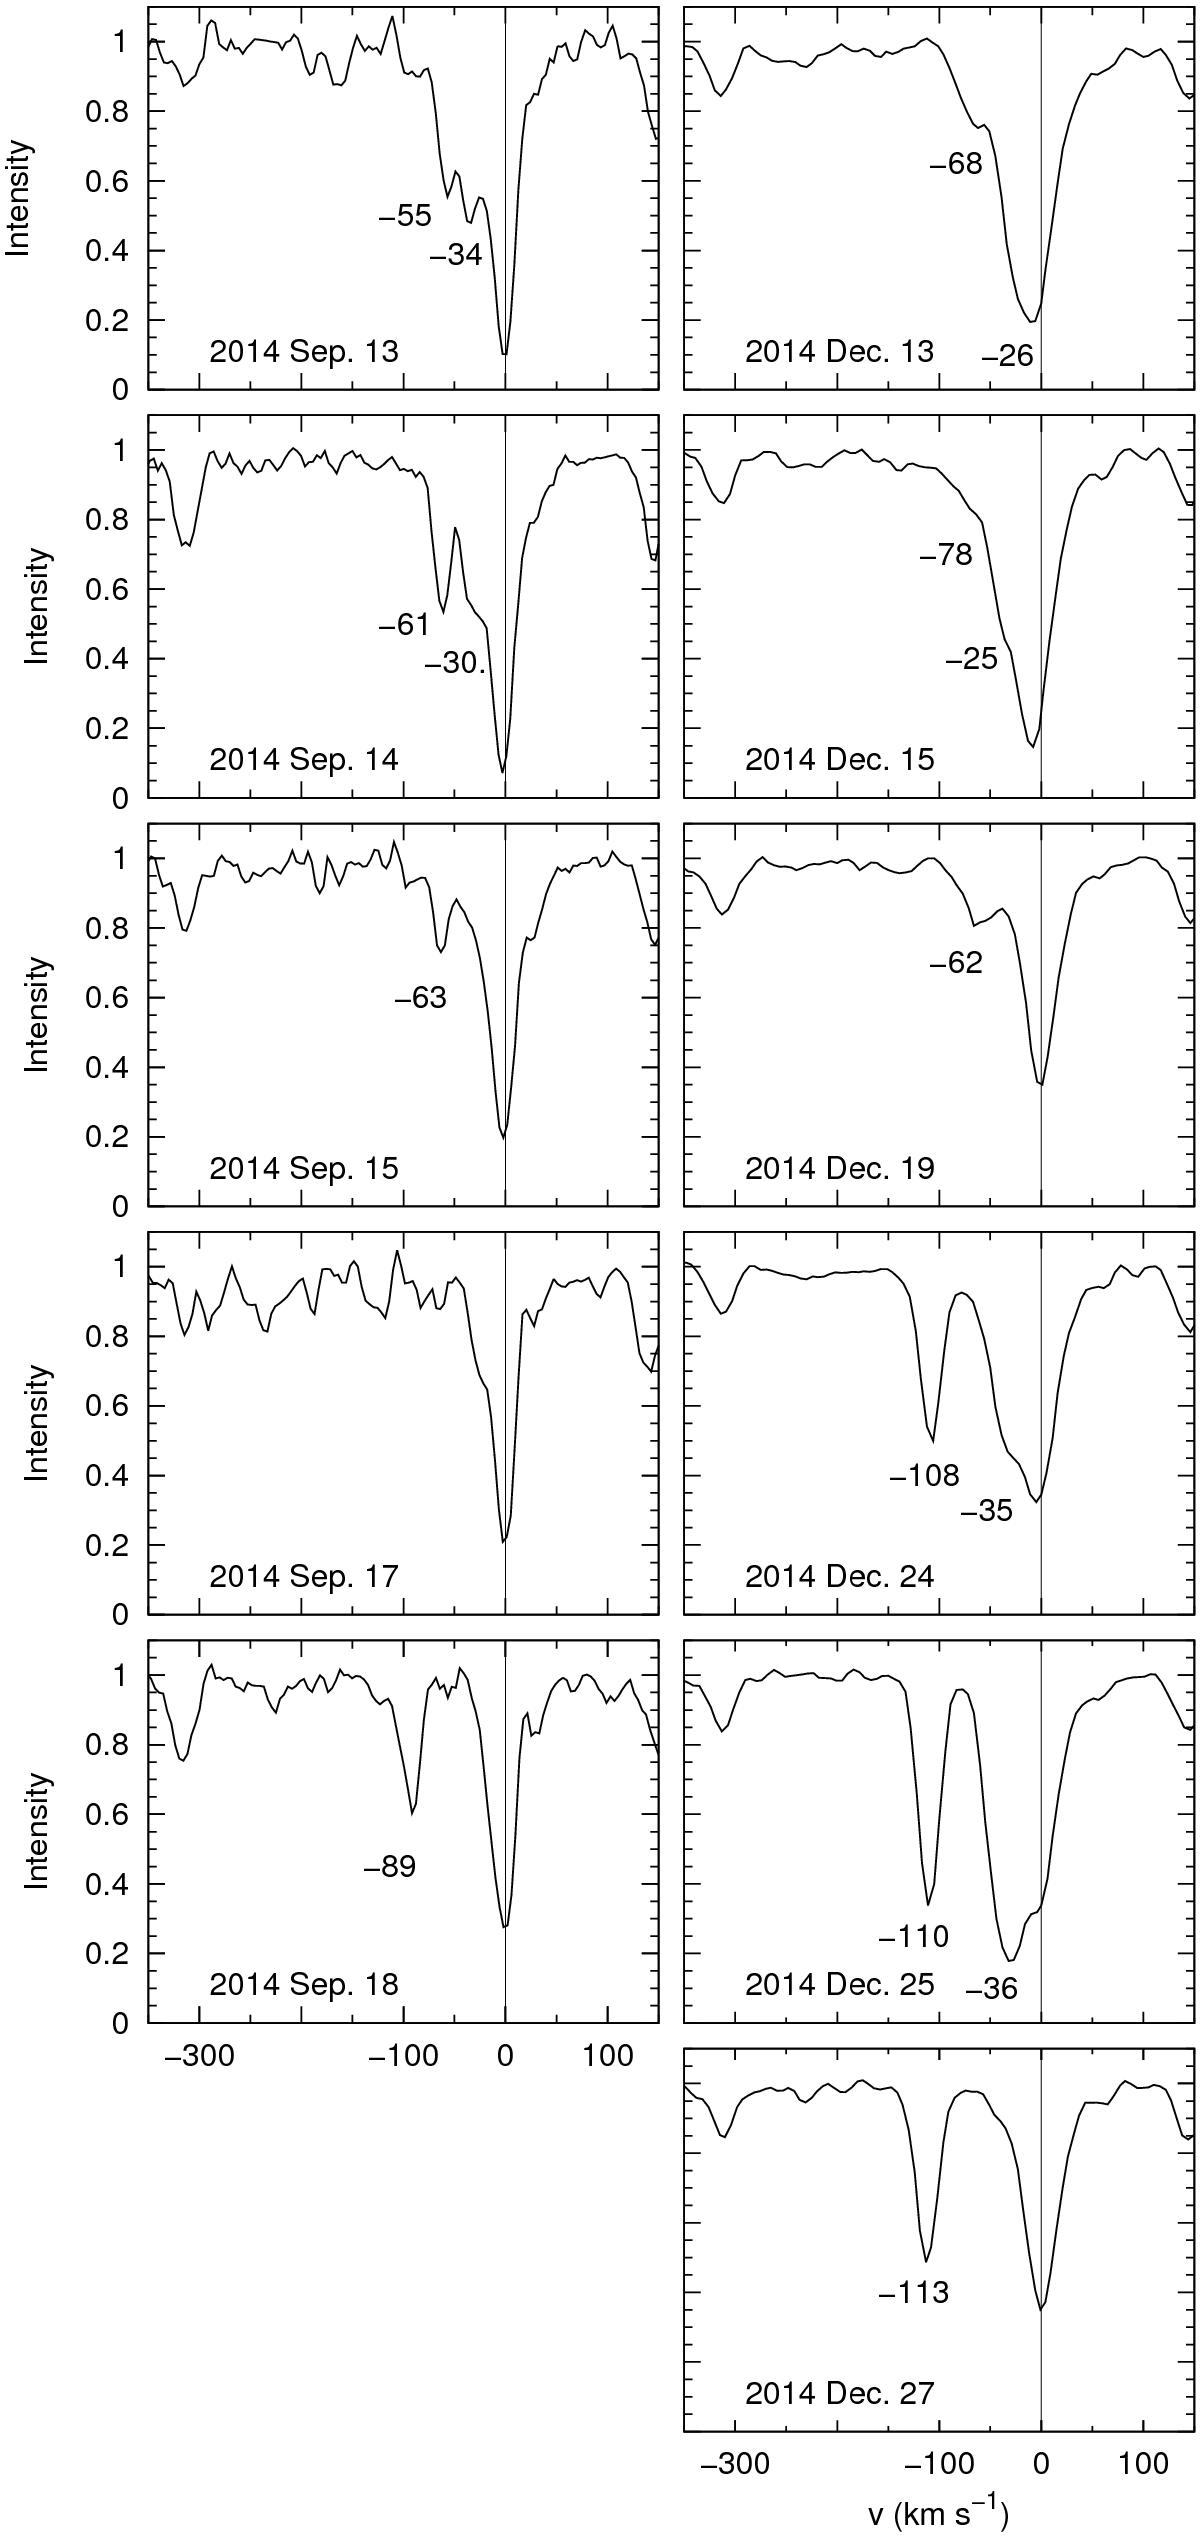
Na iλ5889 lines in the RZ Psc spectra observed with ESPL (left column) and MRES (right column). The velocities of the variable absorption components are labeled in km s-1. The weak absorptions near the red edge of λ5889 line in the ESPL spectra are the residual atmospheric contamination after imperfect telluric correction.
Current usage metrics show cumulative count of Article Views (full-text article views including HTML views, PDF and ePub downloads, according to the available data) and Abstracts Views on Vision4Press platform.
Data correspond to usage on the plateform after 2015. The current usage metrics is available 48-96 hours after online publication and is updated daily on week days.
Initial download of the metrics may take a while.