Fig. 1
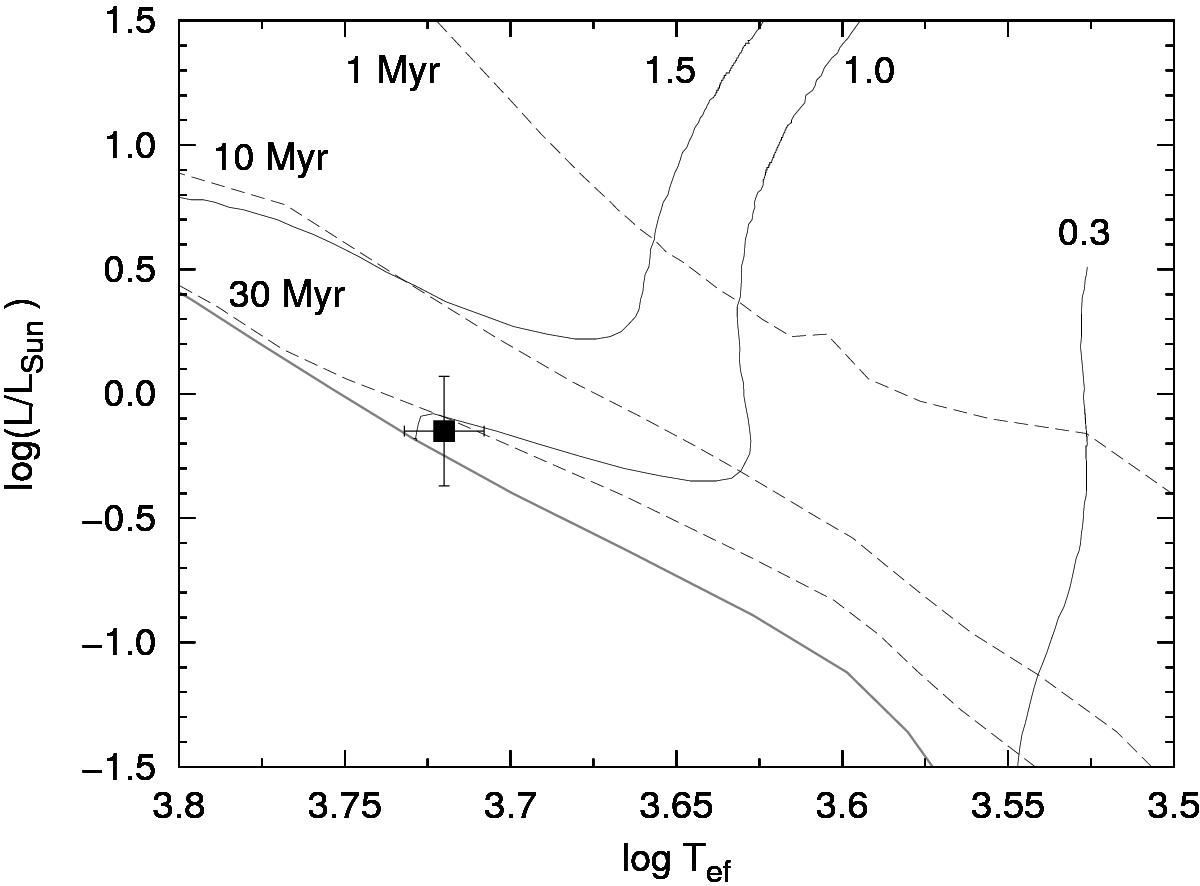
RZ Psc (filled square) on the HR diagram. The errors indicate the precision of the determination of the Teff and lgg. The light gray solid line is the ZAMS. Thin solid lines are the evolutionary tracks from Siess et al. (2000) models, these tracks are labeled with the corresponding values of the stellar masses. The dashed lines are the isochrones for the ages 1, 10, and 30 Myr.
Current usage metrics show cumulative count of Article Views (full-text article views including HTML views, PDF and ePub downloads, according to the available data) and Abstracts Views on Vision4Press platform.
Data correspond to usage on the plateform after 2015. The current usage metrics is available 48-96 hours after online publication and is updated daily on week days.
Initial download of the metrics may take a while.