Fig. 3
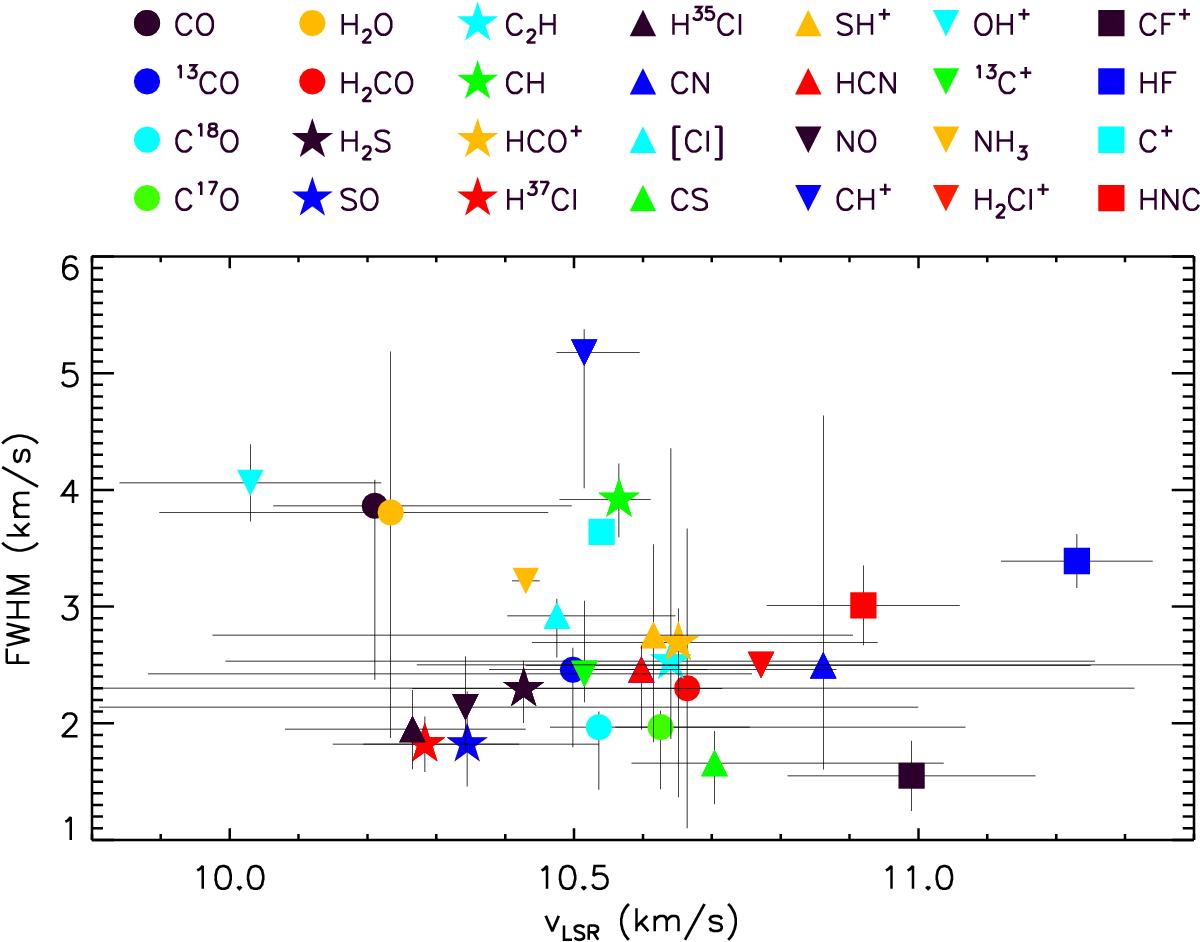
Average line width versus average velocity (weighted by the signal-to-noise ratio of the lines) of all of the detected species in the HEXOS Orion Bar line survey. The error bars represent the ranges of line widths and LSR velocities for the species with multiple detected transitions including an error which is based on the errors of the parameters for the individual transitions from the Gaussian fitting. For the species with only one detected transition, the error bars are from the Gaussian fitting of the line profiles.
Current usage metrics show cumulative count of Article Views (full-text article views including HTML views, PDF and ePub downloads, according to the available data) and Abstracts Views on Vision4Press platform.
Data correspond to usage on the plateform after 2015. The current usage metrics is available 48-96 hours after online publication and is updated daily on week days.
Initial download of the metrics may take a while.