Free Access
Fig. C.4
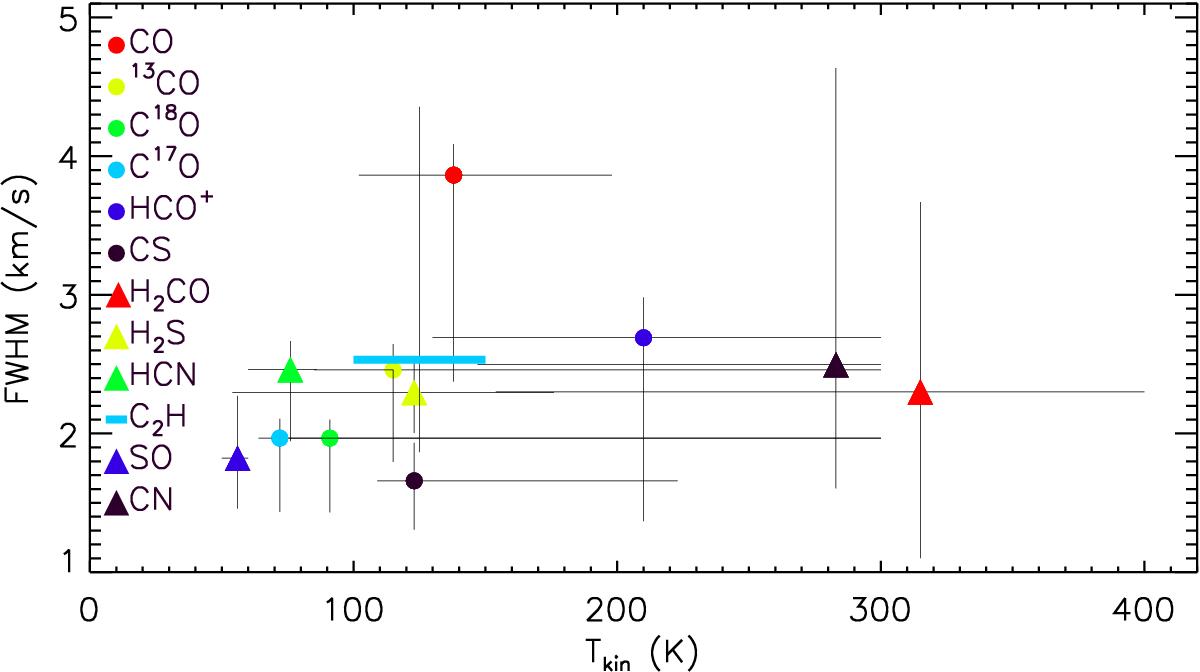
Average line widths (weighted by the signal-to-noise ratio of the transitions) of species with kinetic temperature estimates. For C2H the lower kinetic temperature is plotted as it represents most C2H emission for the observed C2H transitions.
Current usage metrics show cumulative count of Article Views (full-text article views including HTML views, PDF and ePub downloads, according to the available data) and Abstracts Views on Vision4Press platform.
Data correspond to usage on the plateform after 2015. The current usage metrics is available 48-96 hours after online publication and is updated daily on week days.
Initial download of the metrics may take a while.