Fig. 1
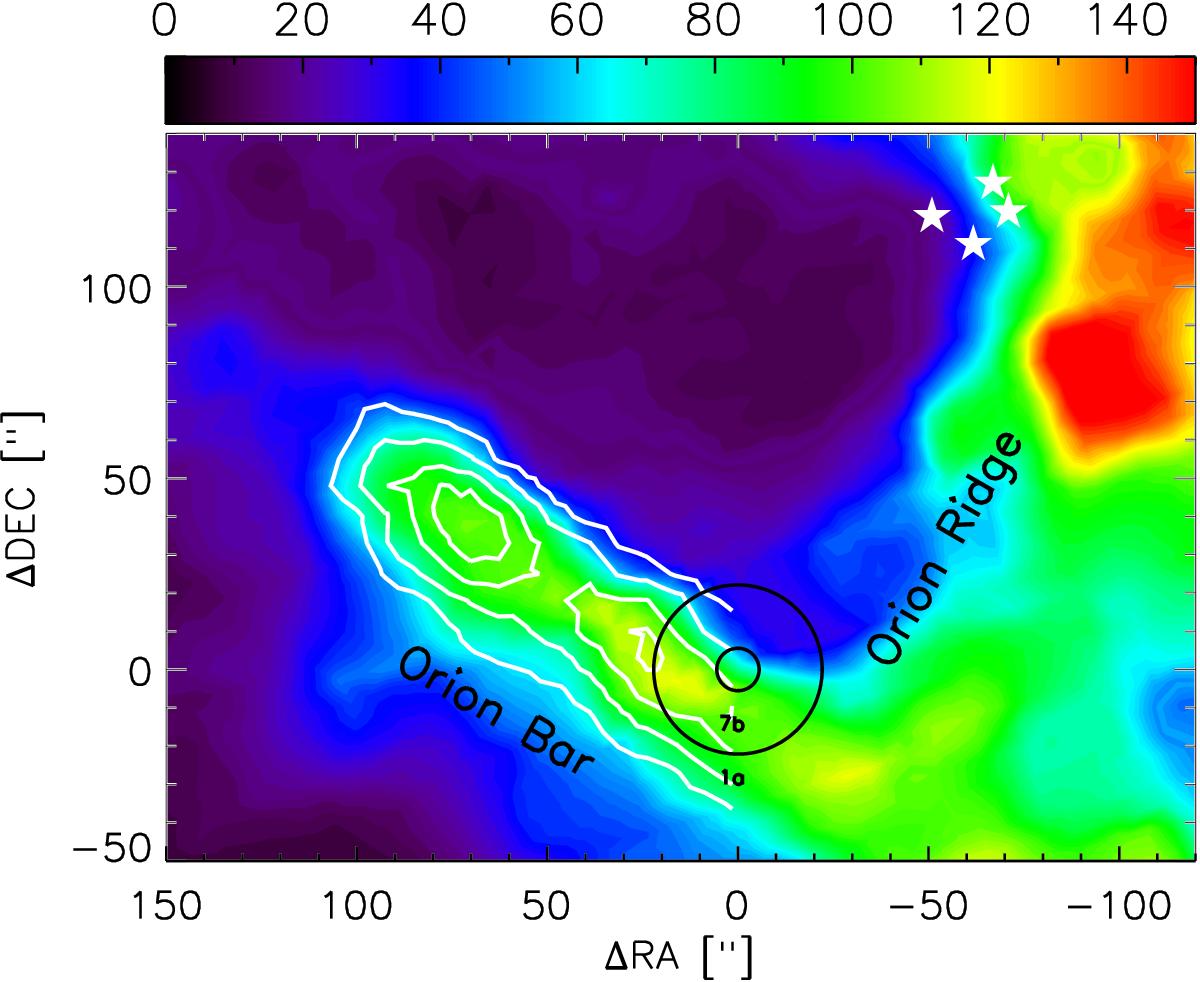
13CO 3–2 integrated intensity (in K km s-1 units) of the Orion Bar observed with the JCMT. The circles at the position of the CO+ peak (αJ2000 = 05h35m20.6s, δJ2000 = −05°25′14′′) indicate the beam sizes corresponding to the smallest (band 7b, ~11′′) and largest (band 1a, ~44′′) beam sizes of the data presented in this line survey. The white symbols show the position of the Trapezium stars. The white contours show the distribution of the integrated intensity (in K km s-1 units) of HCN 4−3 measured with the JCMT (van der Wiel et al. 2009). The contours are 25%, 40%, 60%, and 80% of the peak HCN intensity of ~24 K km s-1.
Current usage metrics show cumulative count of Article Views (full-text article views including HTML views, PDF and ePub downloads, according to the available data) and Abstracts Views on Vision4Press platform.
Data correspond to usage on the plateform after 2015. The current usage metrics is available 48-96 hours after online publication and is updated daily on week days.
Initial download of the metrics may take a while.