Fig. 3
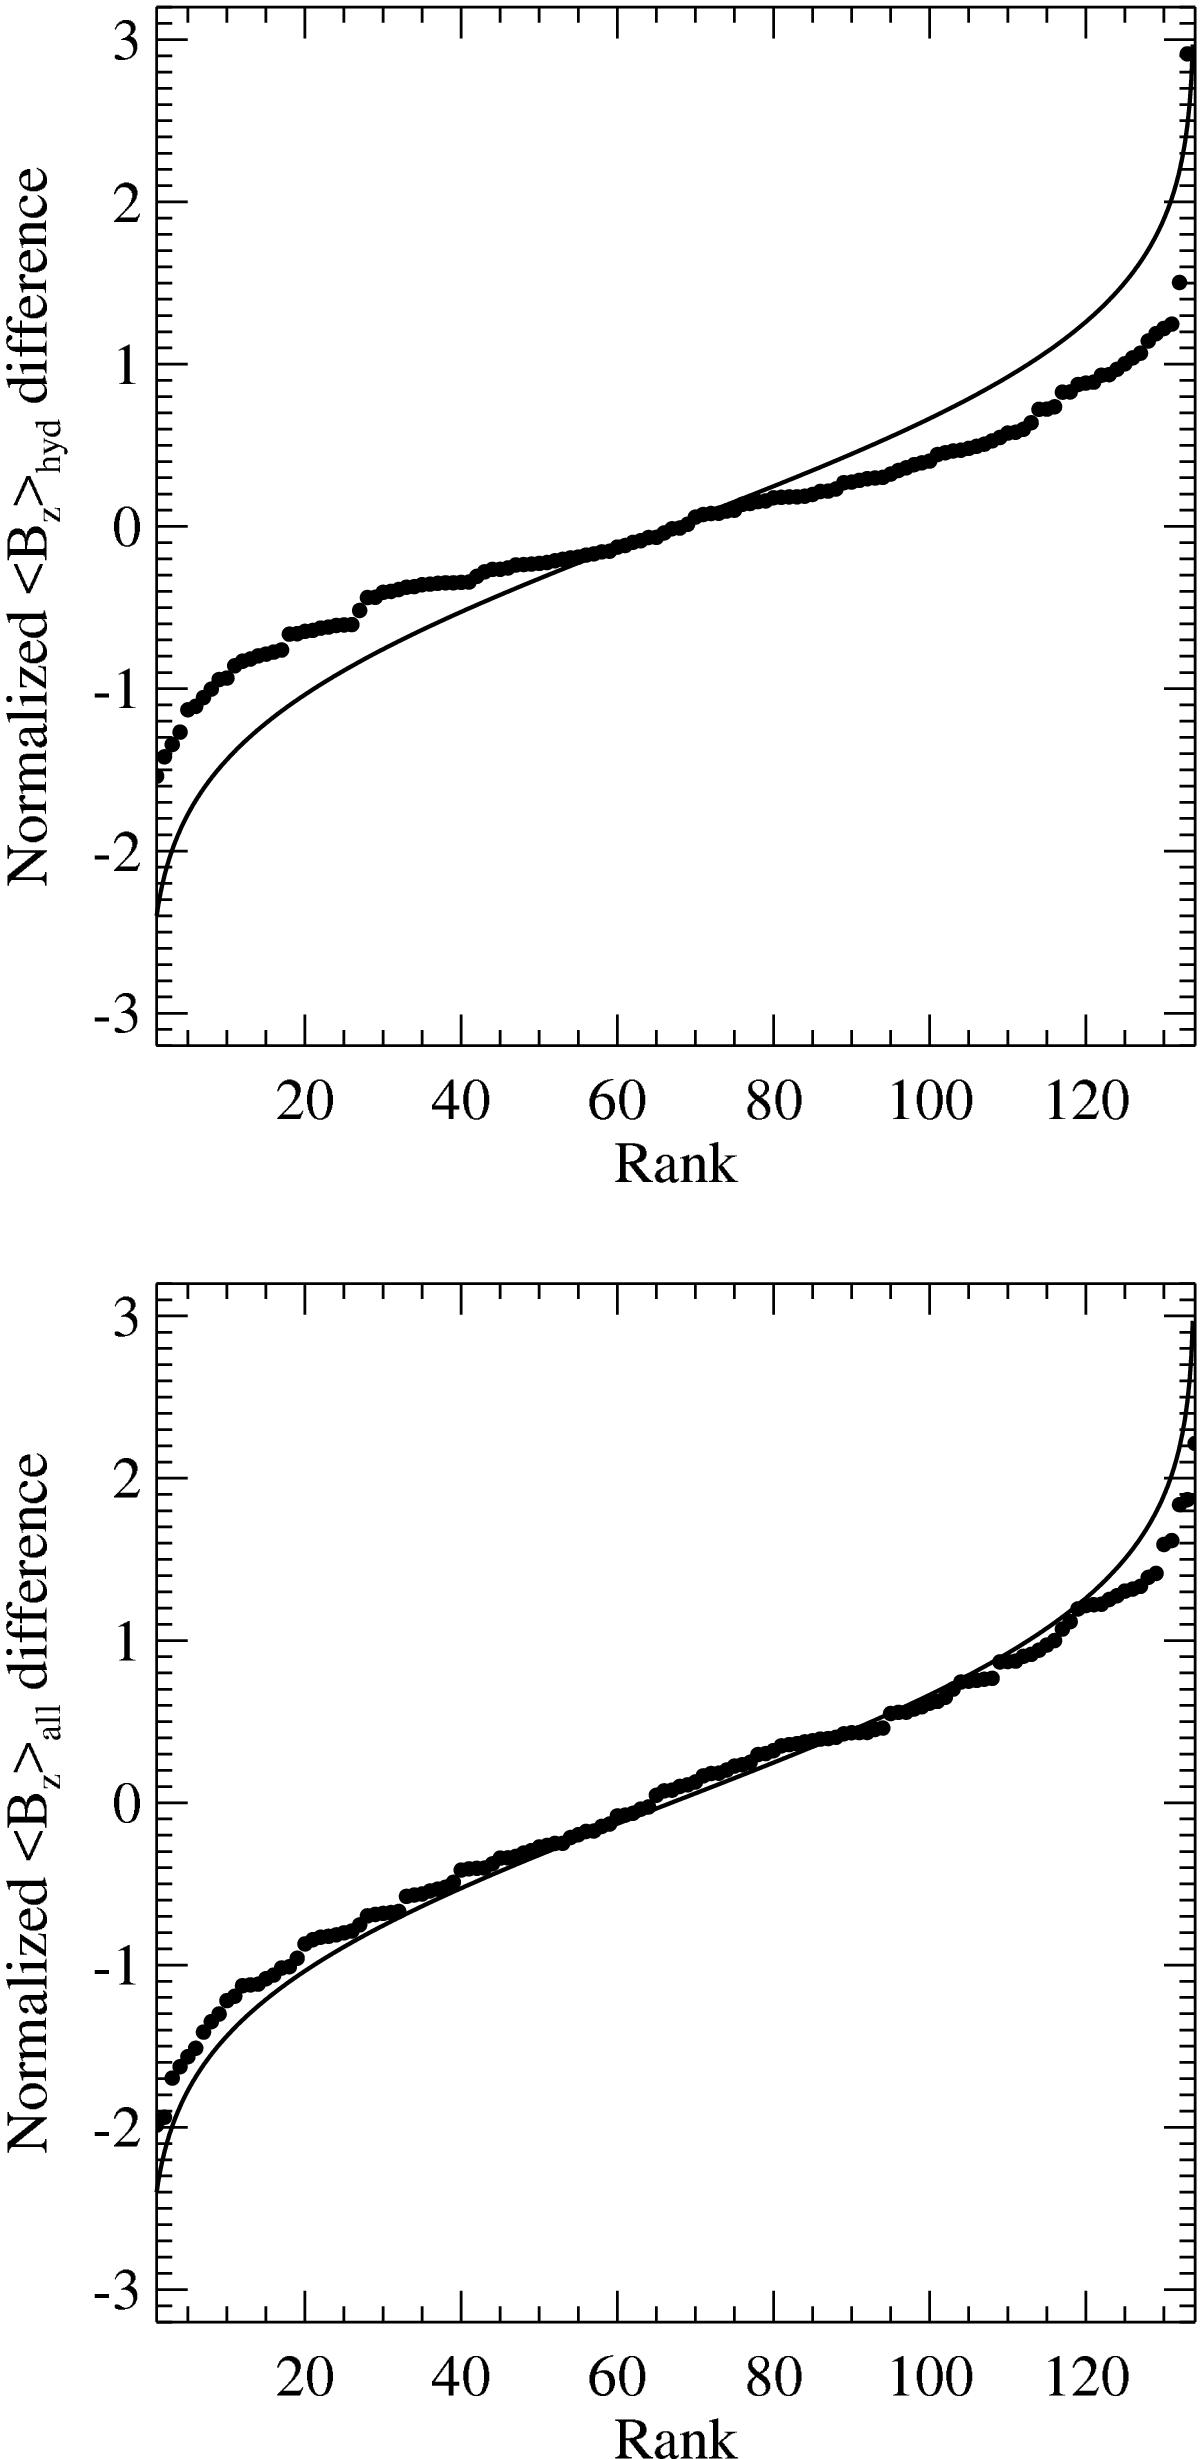
Density distributions for the error-normalized differences between the magnetic field values determined by the Bonn and Potsdam groups for the 134 measurements presented in Fossati et al. (2015) and in this paper. The overlayed lines are for a Gaussian density distribution. Top panel: normalized differences for the ⟨Bz⟩ obtained from hydrogen lines. Bottom panel: normalized differences for the ⟨Bz⟩ obtained from all lines.
Current usage metrics show cumulative count of Article Views (full-text article views including HTML views, PDF and ePub downloads, according to the available data) and Abstracts Views on Vision4Press platform.
Data correspond to usage on the plateform after 2015. The current usage metrics is available 48-96 hours after online publication and is updated daily on week days.
Initial download of the metrics may take a while.