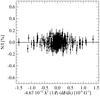
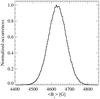
Fig. 1
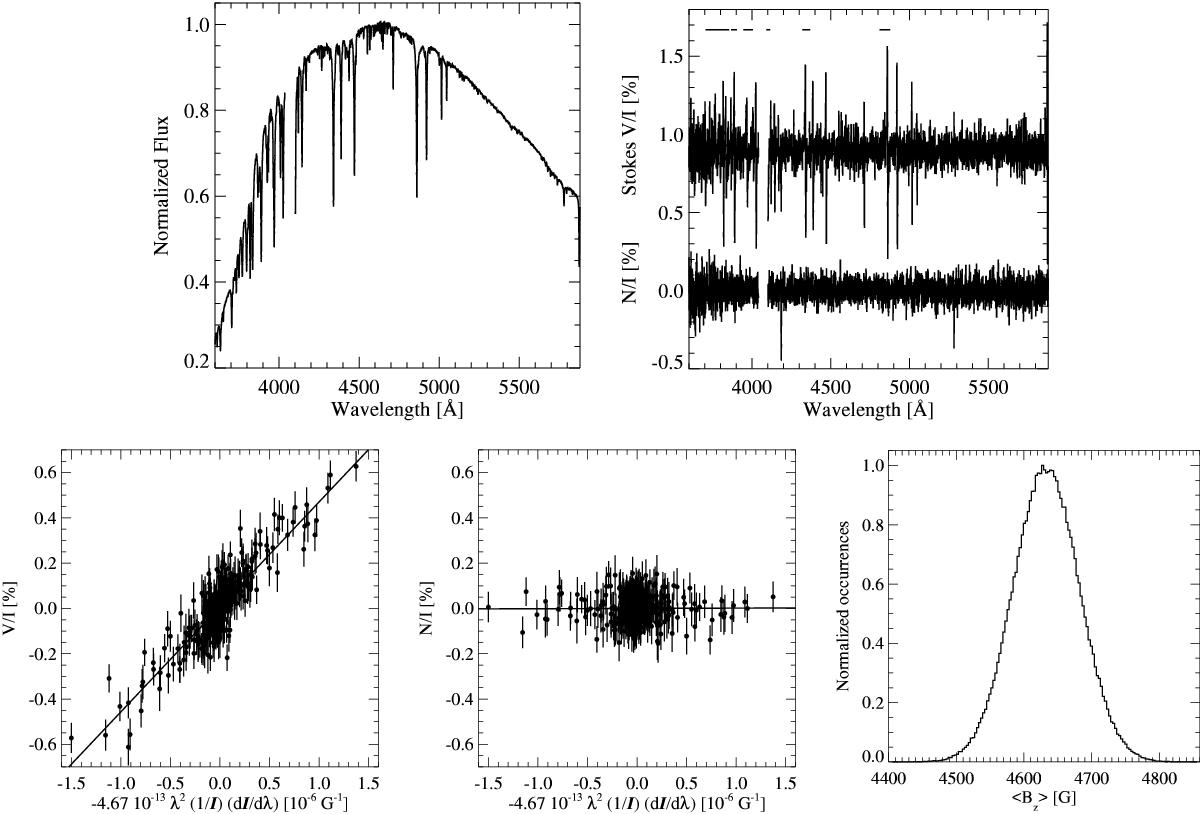
Overview of the results of the analysis of the FORS 2 data of CPD −62° 2124, collected during the night of 2015 March 17, considering the hydrogen lines, using the Potsdam pipeline. Top left panel: observed Stokes I spectrum arbitrarily normalized to the highest value. Top right panel: the top profile shows Stokes V (in %), while the bottom profile shows the spectrum of the N parameter (in %). The Stokes V spectrum is shifted upward by 0.9% for better visibility. The regions used to calculate the longitudinal magnetic field are indicated by horizontal lines close to the top of the panel. Bottom left panel: linear fit to Stokes V. Bottom middle panel: linear fit to the N spectrum. From the linear fit, we determine ⟨Nz⟩ = 28 ± 102 G. Bottom right panel: distribution of the longitudinal magnetic field values P(⟨Bz⟩), which were obtained via bootstrapping. From the distribution P(⟨Bz⟩), we obtain the most likely value for the longitudinal magnetic field ⟨Bz⟩ = 4636 ± 128 G. The gaps in the region around Hδ in the two upper panels result from masking an internal reflection in that spectral range.
Current usage metrics show cumulative count of Article Views (full-text article views including HTML views, PDF and ePub downloads, according to the available data) and Abstracts Views on Vision4Press platform.
Data correspond to usage on the plateform after 2015. The current usage metrics is available 48-96 hours after online publication and is updated daily on week days.
Initial download of the metrics may take a while.