Fig. A.1
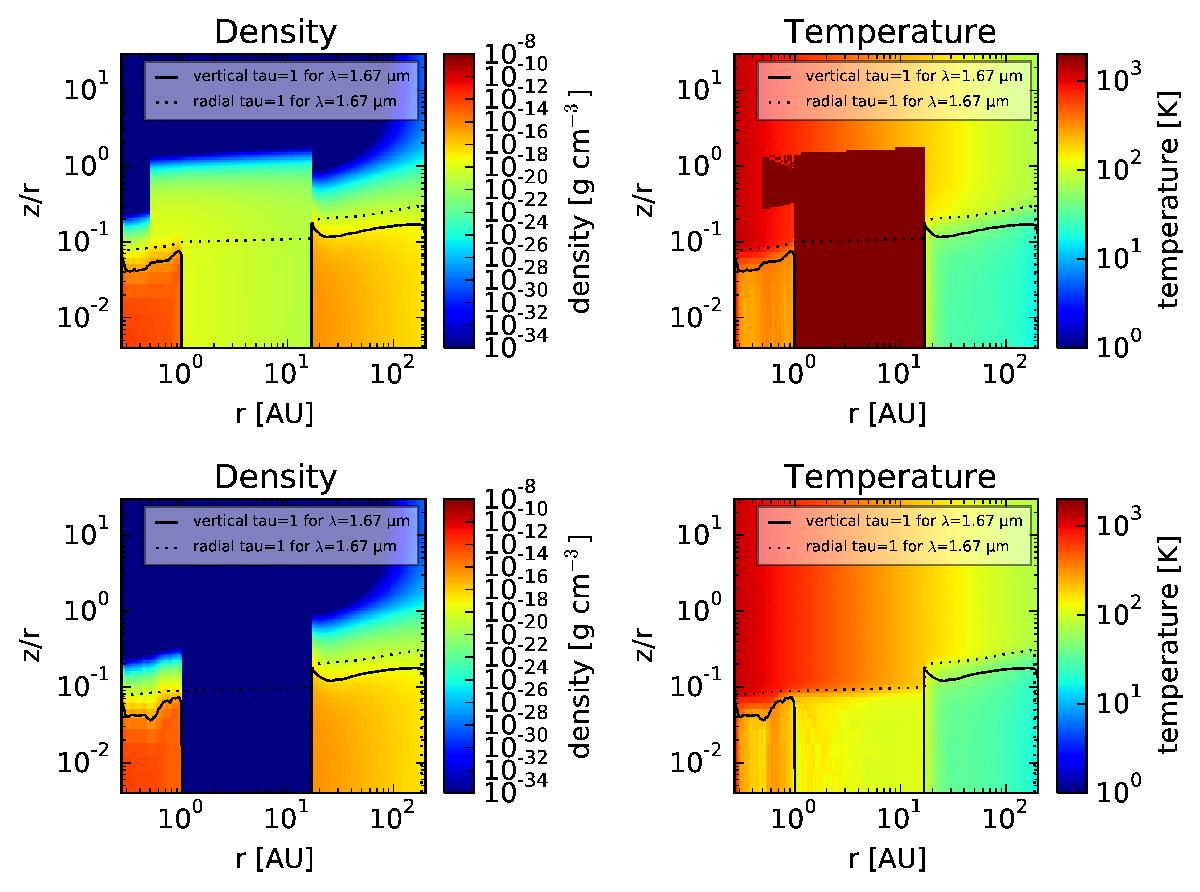
Final density and temperature structure for a model set-up with (upper row, S18C100K) and without QHPs (lower row). The x-axis shows the radius in au, the y-axis the height divided by the radius. The colour of the left plots indicate the mass density, the colours of the right plot the temperature. The dark red area shows the regions with QHP emission. The optical depth at the observation wavelength is indicated by the radial (dotted line) and vertical (full line) τ = 1 surface.
Current usage metrics show cumulative count of Article Views (full-text article views including HTML views, PDF and ePub downloads, according to the available data) and Abstracts Views on Vision4Press platform.
Data correspond to usage on the plateform after 2015. The current usage metrics is available 48-96 hours after online publication and is updated daily on week days.
Initial download of the metrics may take a while.