Free Access
Fig. 5
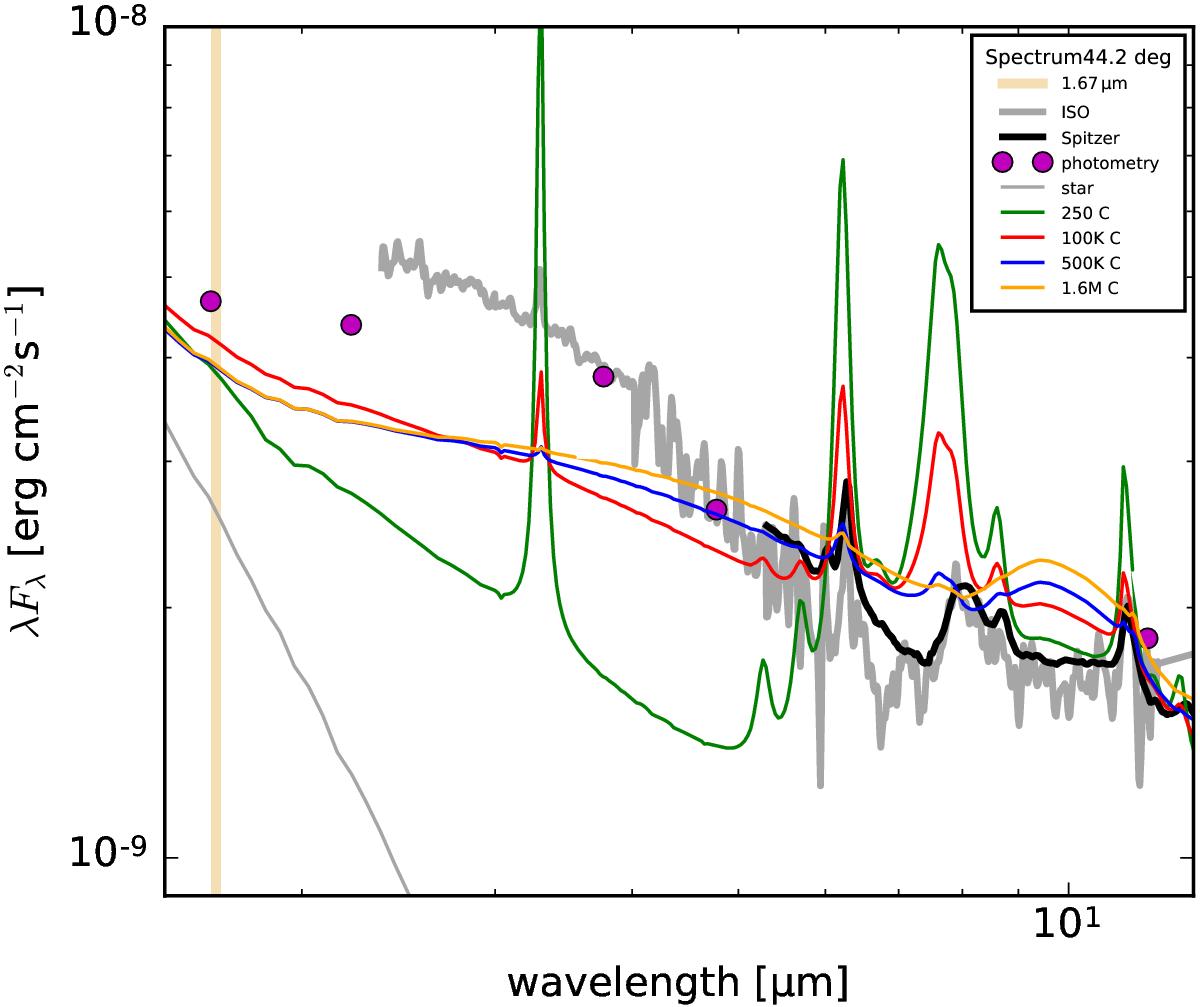
Influence of the QHP size on the strength of the PAH features. The ISO and Spitzer spectra are shown in grey and black. The photometry data is indicated by pink dots. A light yellow bar indicates 1.67μm. The stellar spectrum is shown in light grey. The models have the same colours as in Fig. 4.
Current usage metrics show cumulative count of Article Views (full-text article views including HTML views, PDF and ePub downloads, according to the available data) and Abstracts Views on Vision4Press platform.
Data correspond to usage on the plateform after 2015. The current usage metrics is available 48-96 hours after online publication and is updated daily on week days.
Initial download of the metrics may take a while.