Fig. 4
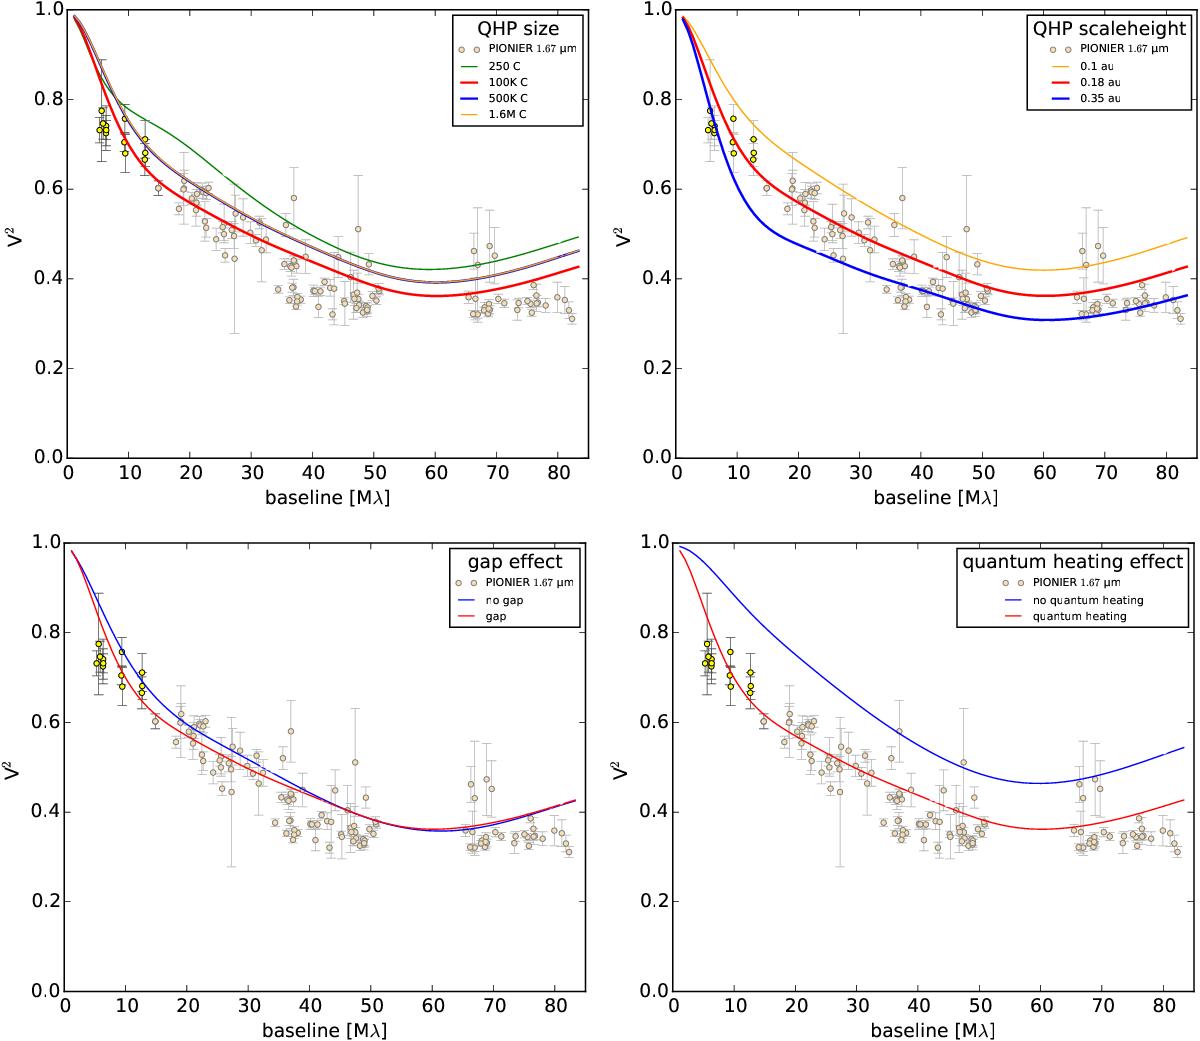
All panels: squared, normalised visibilities V2 against baseline in Mλ. The yellow circles show the 1.67μm data of HD 100453 from the PIONIER Herbig Ae/Be survey (Lazareff et al. 2017; Kluska et al. 2016). For this analysis, only the short baselines are of interest (brightly coloured symbols). The red line shows our best model, S18C100K. Top panels: we show the effect of different QHP sizes (green: S18C250, red: S18C100K, blue: S18C500K and yellow: S18C1.6M) and scale heights (yellow: S10C100K, red: S18C100K, blue: S35C100K). Lower left panel: the QHPs lead to a drop (albeit small) even without the presence of a gap. Lower right panel: we show the effect of quantum heating. For the model corresponding to the blue line, S18C100Knqh, the grains behave like conventional dust. The drop at short baselines vanishes.
Current usage metrics show cumulative count of Article Views (full-text article views including HTML views, PDF and ePub downloads, according to the available data) and Abstracts Views on Vision4Press platform.
Data correspond to usage on the plateform after 2015. The current usage metrics is available 48-96 hours after online publication and is updated daily on week days.
Initial download of the metrics may take a while.