Free Access
Fig. 3
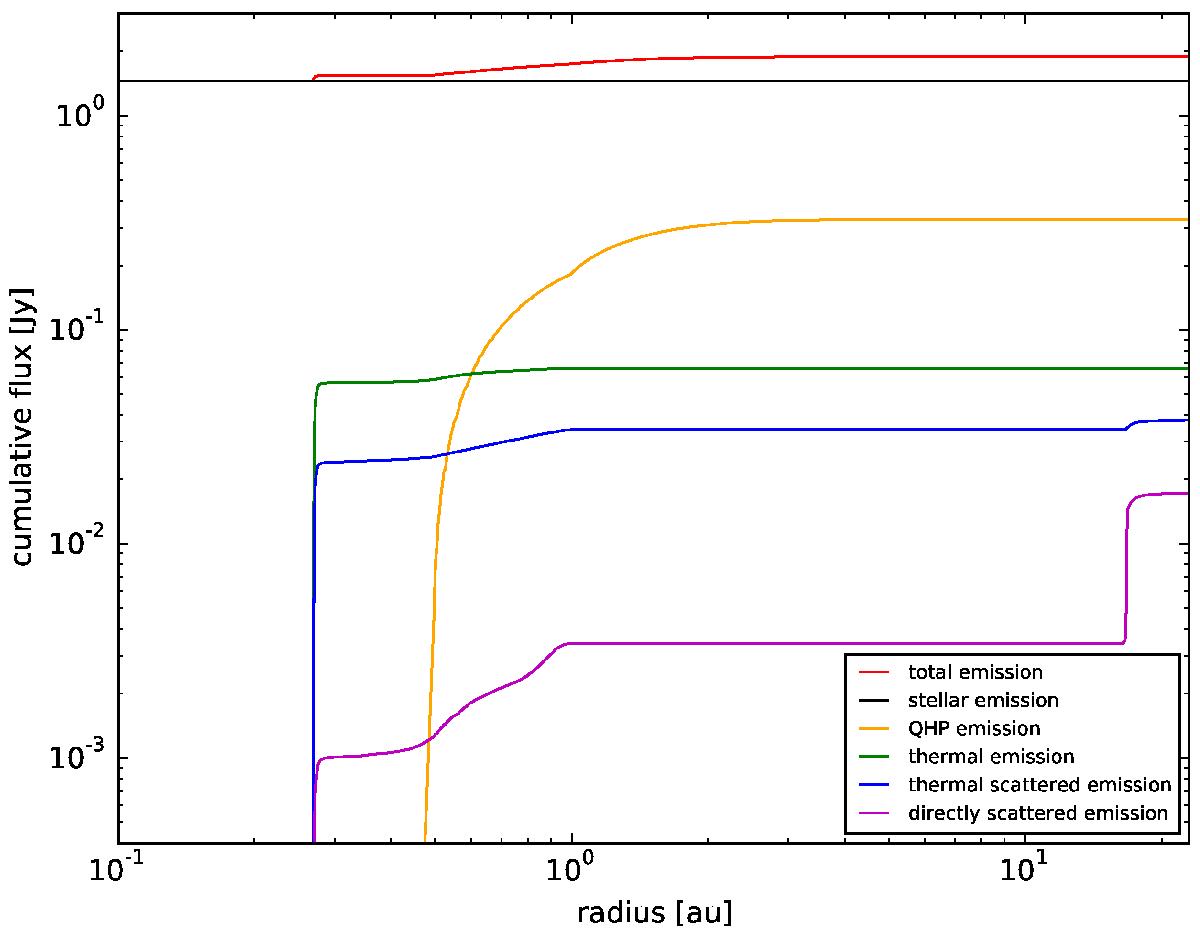
Cumulative H-band flux for model S18C100K, plotted against the distance from the star and split into the different components: total emission (red); stellar emission (black); QHP emission (yellow); thermal emission (green); thermal scattered emission (blue); directly scattered emission (pink).
Current usage metrics show cumulative count of Article Views (full-text article views including HTML views, PDF and ePub downloads, according to the available data) and Abstracts Views on Vision4Press platform.
Data correspond to usage on the plateform after 2015. The current usage metrics is available 48-96 hours after online publication and is updated daily on week days.
Initial download of the metrics may take a while.