Fig. 2
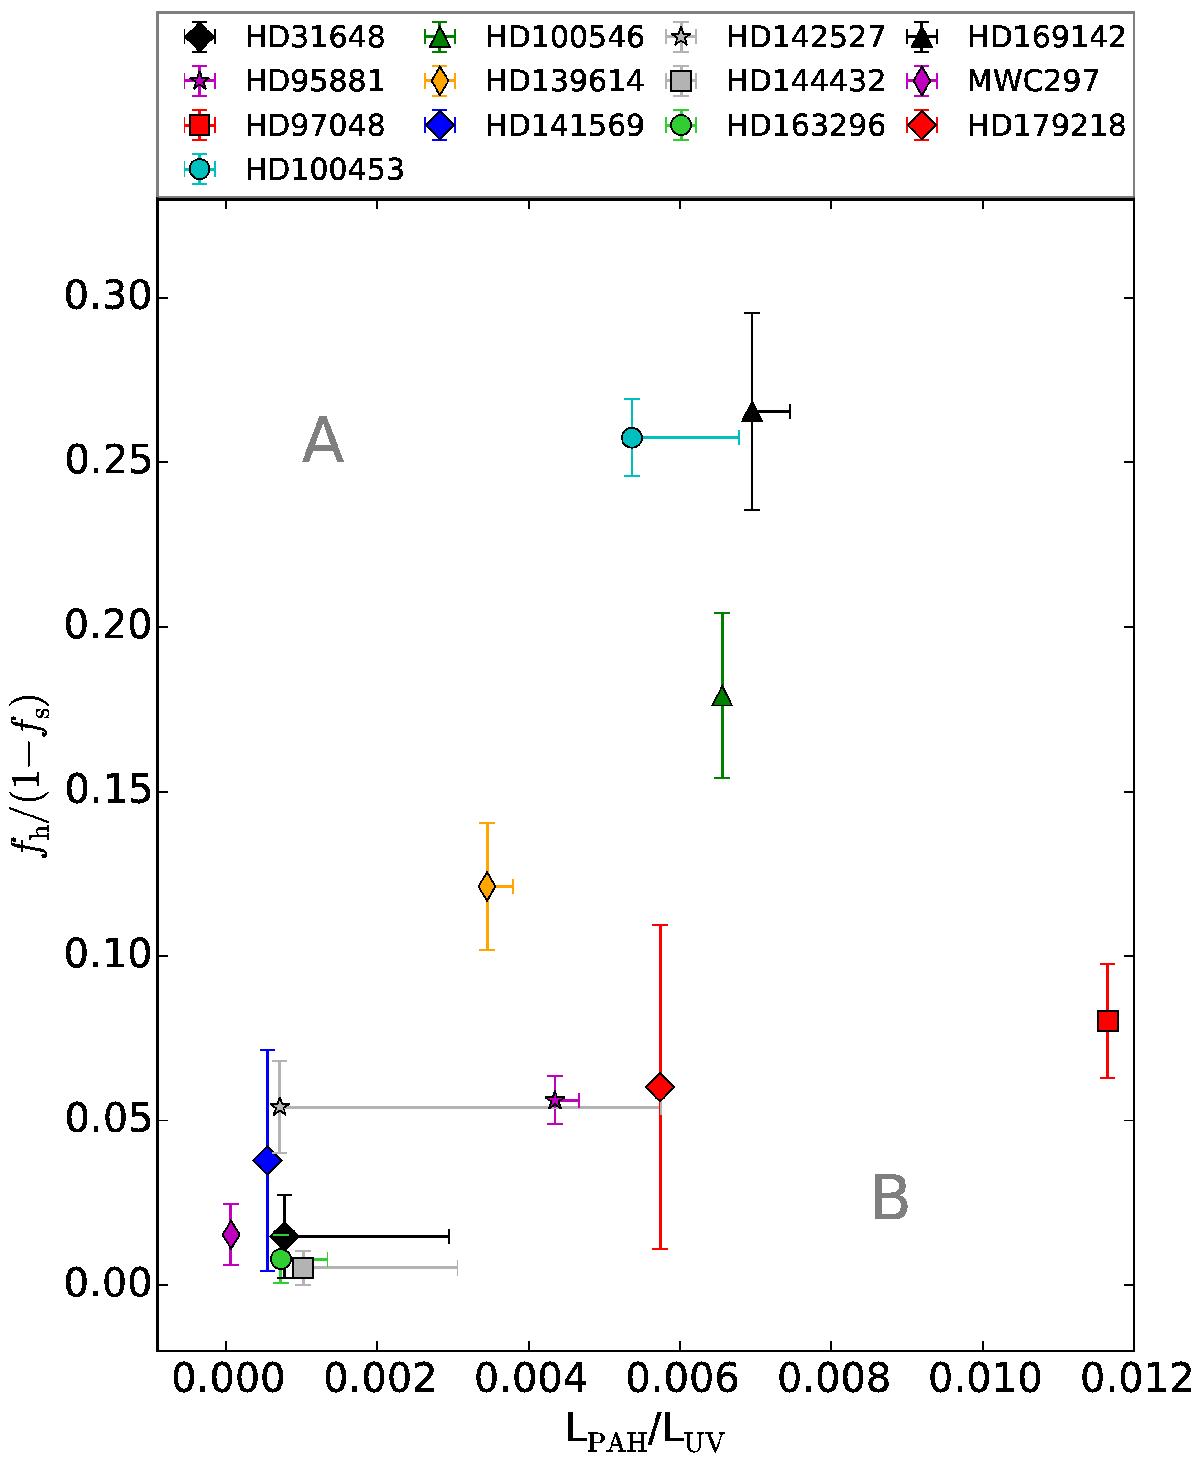
Extended flux as calculated from the PIONIER survey (Lazareff et al. 2017) plotted against the normalised PAH luminosity from the ISO observations (Acke & van den Ancker 2004). For most disks, only an upper limit is given for one or more of the PAH features. In that case, the symbol indicates the actually observed luminosity, while the horizontal error bar indicates the luminosity including upper limits. The legend shows the name of each source.
Current usage metrics show cumulative count of Article Views (full-text article views including HTML views, PDF and ePub downloads, according to the available data) and Abstracts Views on Vision4Press platform.
Data correspond to usage on the plateform after 2015. The current usage metrics is available 48-96 hours after online publication and is updated daily on week days.
Initial download of the metrics may take a while.