Fig. 7
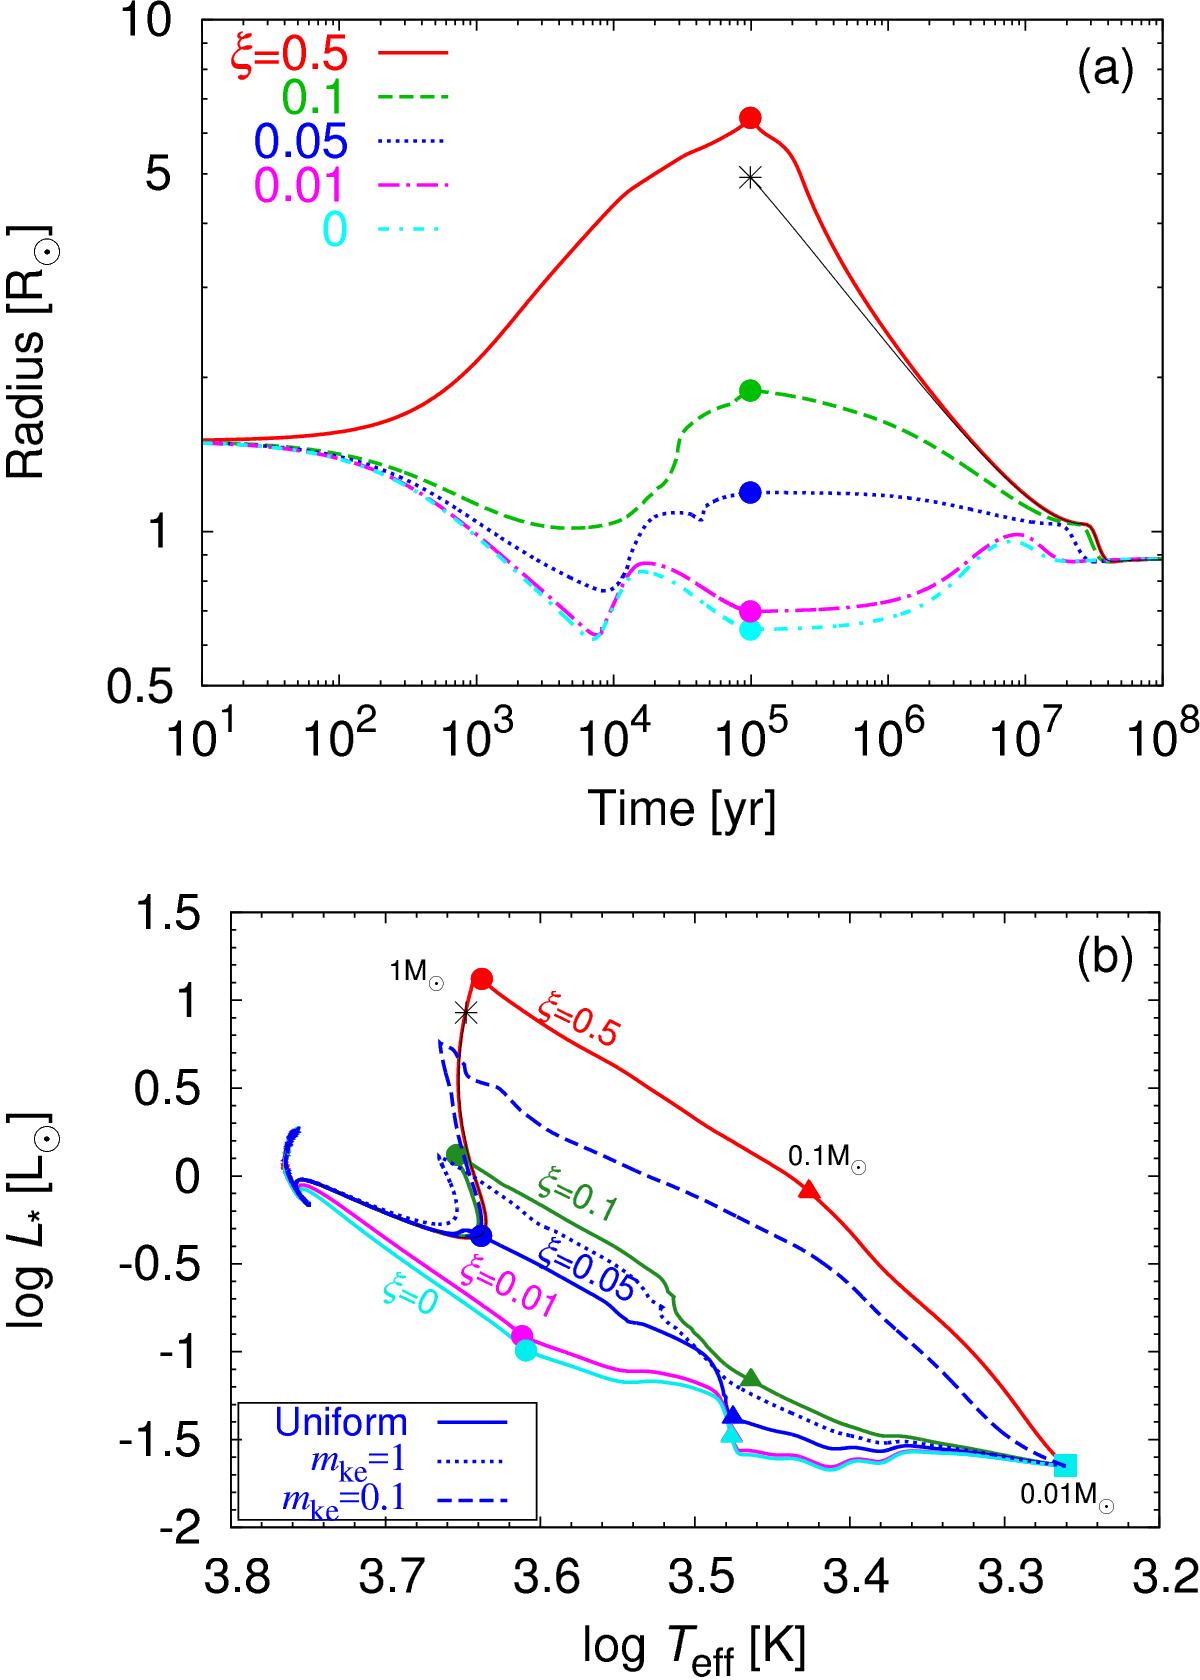
Top panel: radius evolution for various heat injection efficiencies, ξ = 0.5 (solid line), 0.1 (dashed), 0.05 (dotted), 0.01 (dot-dashed), and 0 (double dot-dashed). The classical PMS evolution, which is indicated by the thin solid line and starts at the asterisks, has a substantial overlap with the lines of ξ = 0.5. Bottom panel: evolutionary tracks with different ξ ranging 0.5 (red line), 0.1 (green), 0.05 (blue), 0.01 (magenta) and 0 (cyan). The solid, dotted, and dashed lines represent the cases with uniform heat injection, mke = 1, and mke = 0.1, respectively. In both panels, we adopt XD = 20 ppm and Rini = 1.5 R⊙.
Current usage metrics show cumulative count of Article Views (full-text article views including HTML views, PDF and ePub downloads, according to the available data) and Abstracts Views on Vision4Press platform.
Data correspond to usage on the plateform after 2015. The current usage metrics is available 48-96 hours after online publication and is updated daily on week days.
Initial download of the metrics may take a while.