Fig. 6
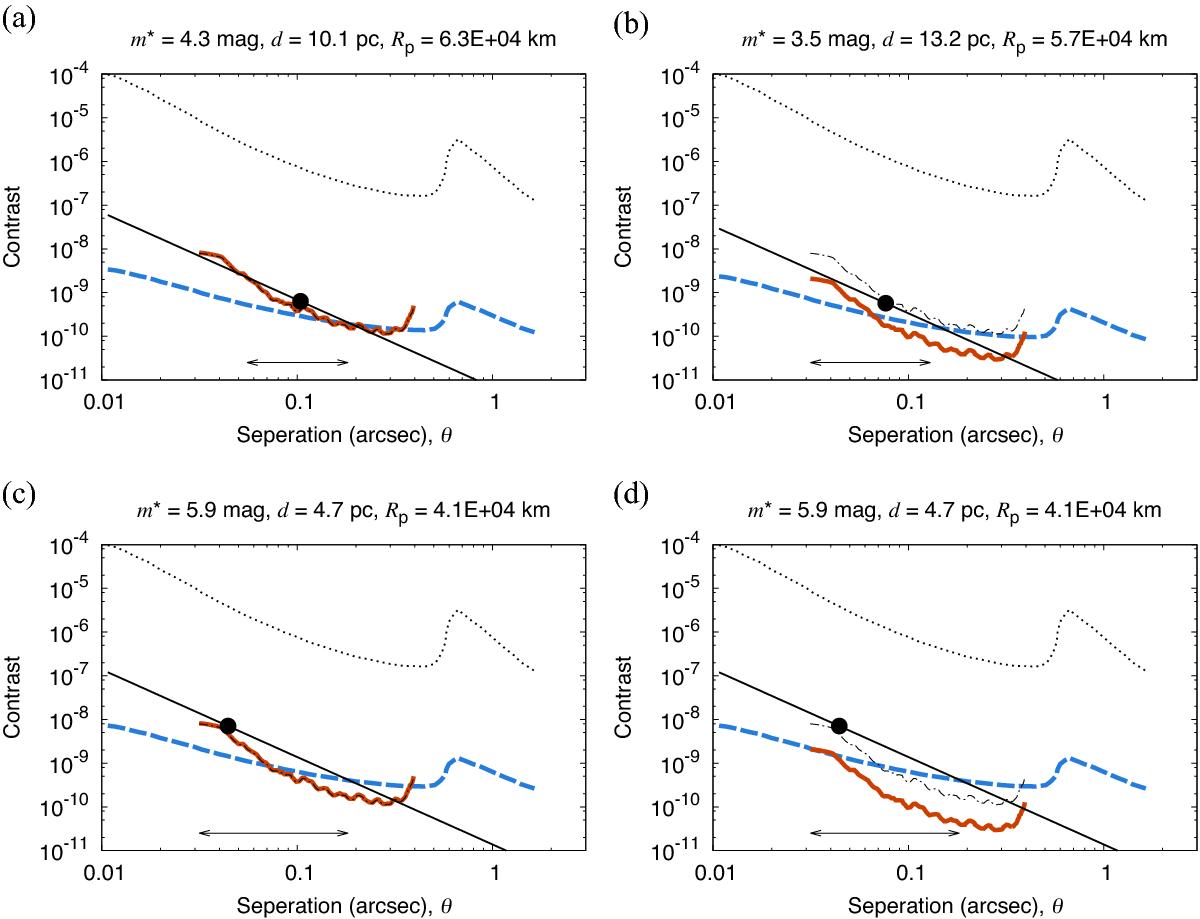
Comparison of contrasts. Contrast performance limited by the speckle noises (bold solid lines) and by the photon noise (dashed lines) is compared with ΔPCp/s (filled circles), that is, contrast of the polarized feature signal. a) a “typical” planet with averaged properties of the observable planets with g = 1.0. b) same as a) except for g = 0.05. c) Gliese 876 b with g = 1.0. d) Gliese 876 b with g = 0.05. The thin solid line in each panel is ΔPCp/s(θ) for a planet with the same radius. The polarization feature is detectable in the ranges of θ designated by the arrows. 3-sigma Cdet (dashed-dotted lines) and Craw (dotted lines) are also plotted for the reference.
Current usage metrics show cumulative count of Article Views (full-text article views including HTML views, PDF and ePub downloads, according to the available data) and Abstracts Views on Vision4Press platform.
Data correspond to usage on the plateform after 2015. The current usage metrics is available 48-96 hours after online publication and is updated daily on week days.
Initial download of the metrics may take a while.