Fig. A.4
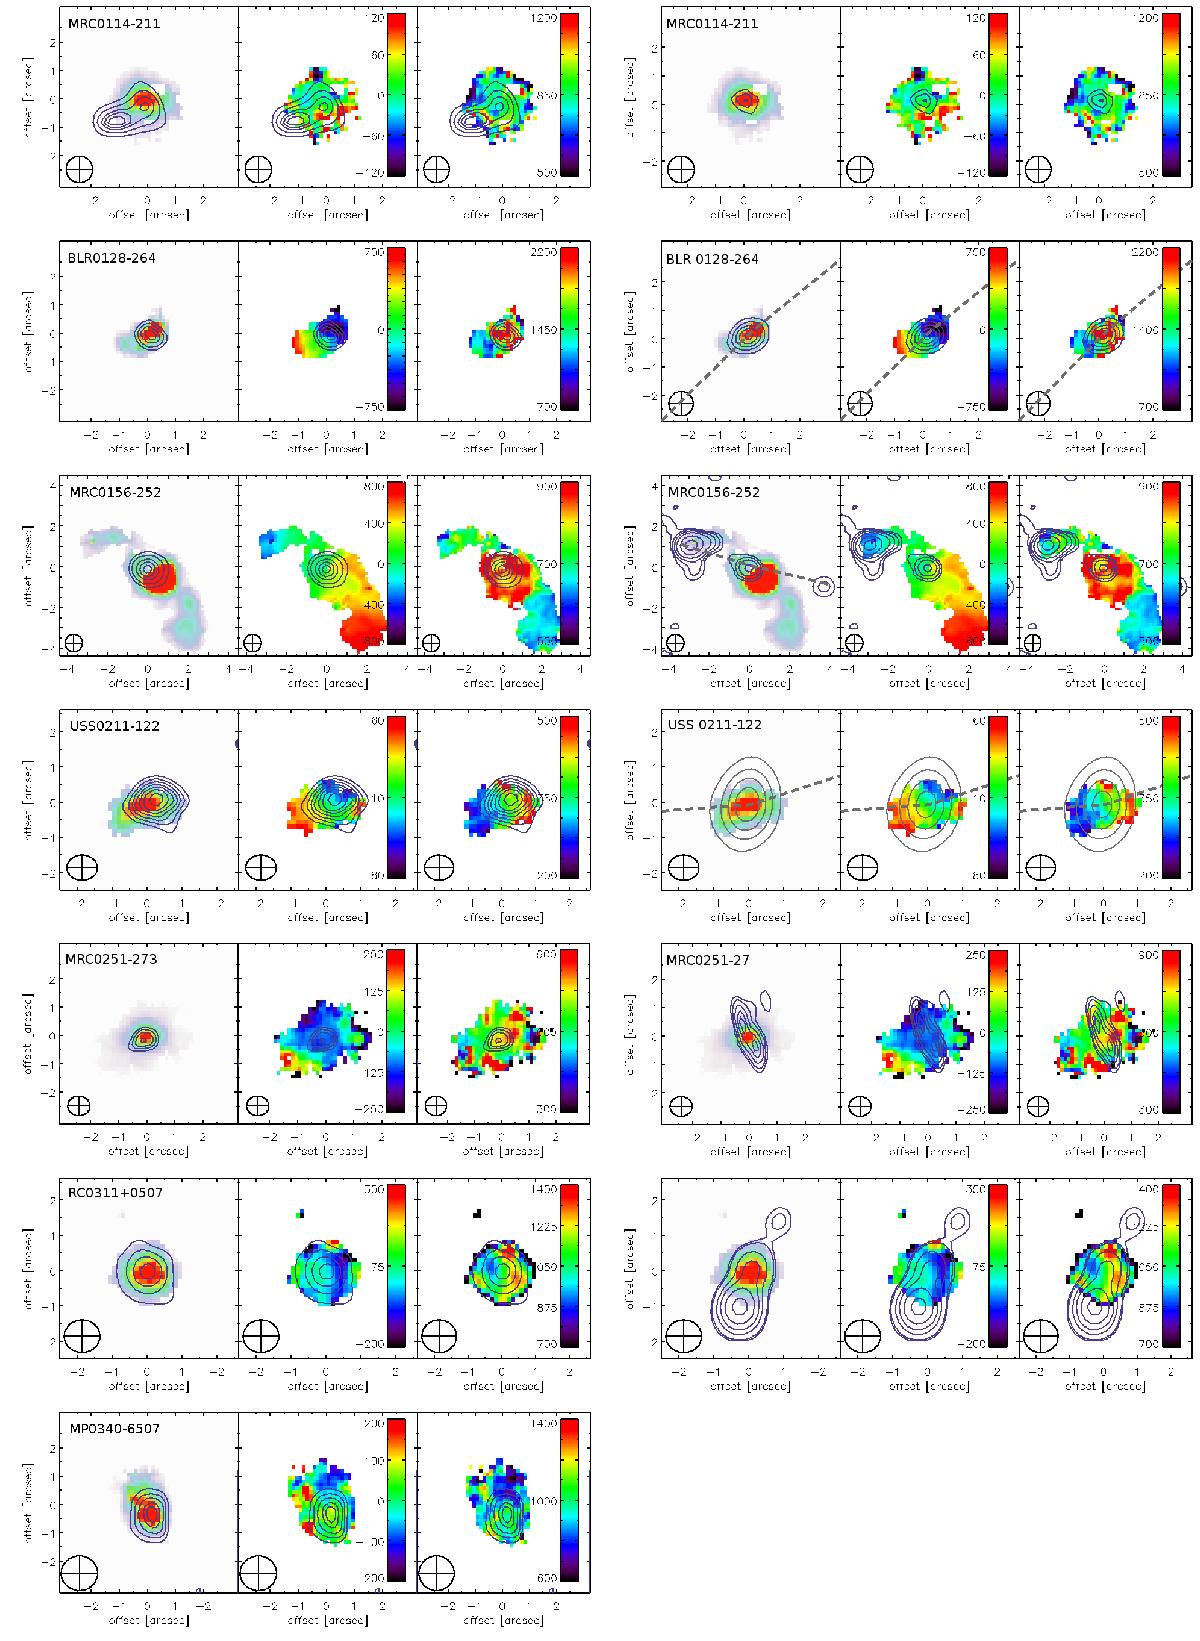
Maps of our galaxies in order of RA, with the rest-frame optical continuum shown as contours in the left, and the GHz radio continuum in the right panel. In each panel, maps show (from left to right) emission-line morphology, velocities relative to the average redshift of all pixels covered by the emission-line region, and FWHM line width. Relative velocities and line widths are given in km s-1. In galaxies where we did not detect the rest-frame optical continuum, we show the emission-line morphology instead of the optical continuum (with red contours, the continuum is shown as blue contours). Coordinates are given relative to the position listed in Table 1. Contour levels are arbitrary, their main purpose is to guide the eye.
Current usage metrics show cumulative count of Article Views (full-text article views including HTML views, PDF and ePub downloads, according to the available data) and Abstracts Views on Vision4Press platform.
Data correspond to usage on the plateform after 2015. The current usage metrics is available 48-96 hours after online publication and is updated daily on week days.
Initial download of the metrics may take a while.