Fig. 22
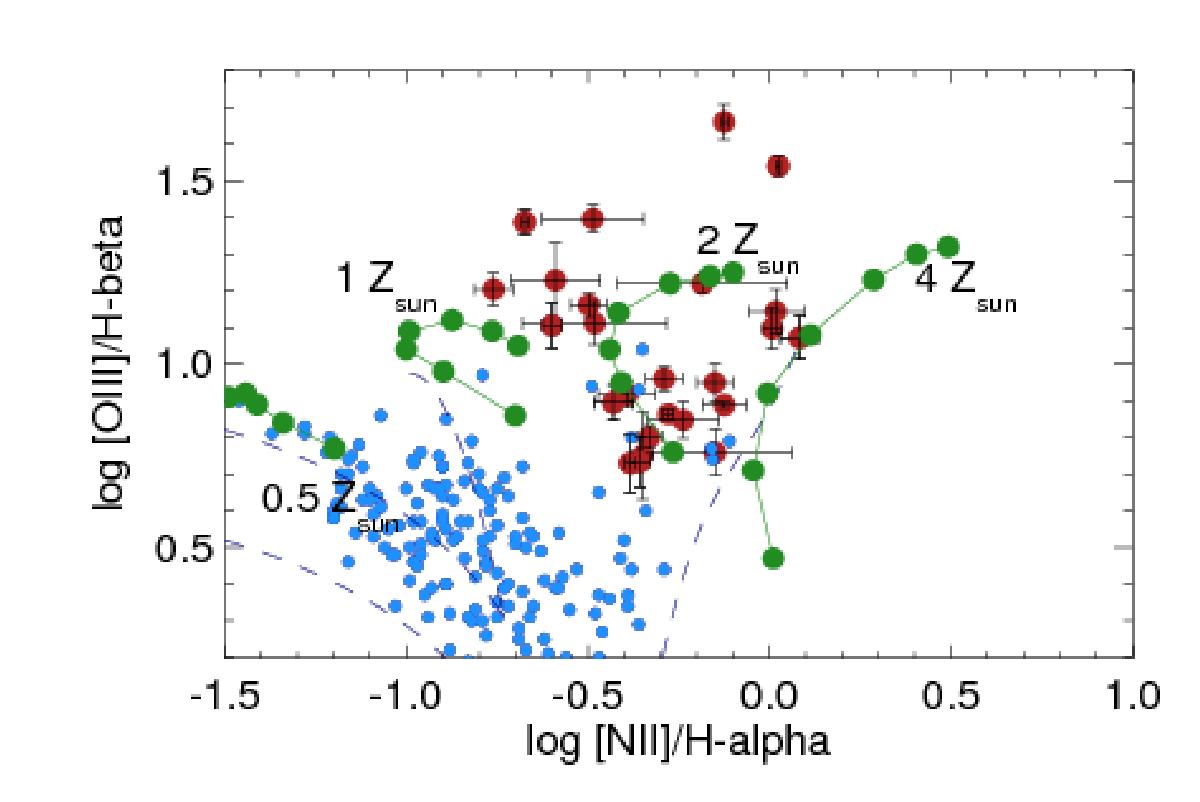
[NII]/Hα vs. [OIII]/Hβ diagnostic diagram with our sources as already shown in Fig. 2, but now also with the tracks for different metallicities overplotted that Groves et al. (2006) modeled for galaxies with narrow-line regions of different metallicity (green dots and lines) and a range of ionization parameter (see Table 2 in Groves et al. 2006, for details). The range of our sources corresponds well to metallicities between 1 and 4× the solar value. Dashed dark blue lines indicate the star-forming and AGN sequence from Kewley et al. (2013a). Light blue dots show the sample of Steidel et al. (2014) of UV/optically selected star-forming galaxies at similar redshifts, and with detections of all four lines.
Current usage metrics show cumulative count of Article Views (full-text article views including HTML views, PDF and ePub downloads, according to the available data) and Abstracts Views on Vision4Press platform.
Data correspond to usage on the plateform after 2015. The current usage metrics is available 48-96 hours after online publication and is updated daily on week days.
Initial download of the metrics may take a while.