Fig. 21
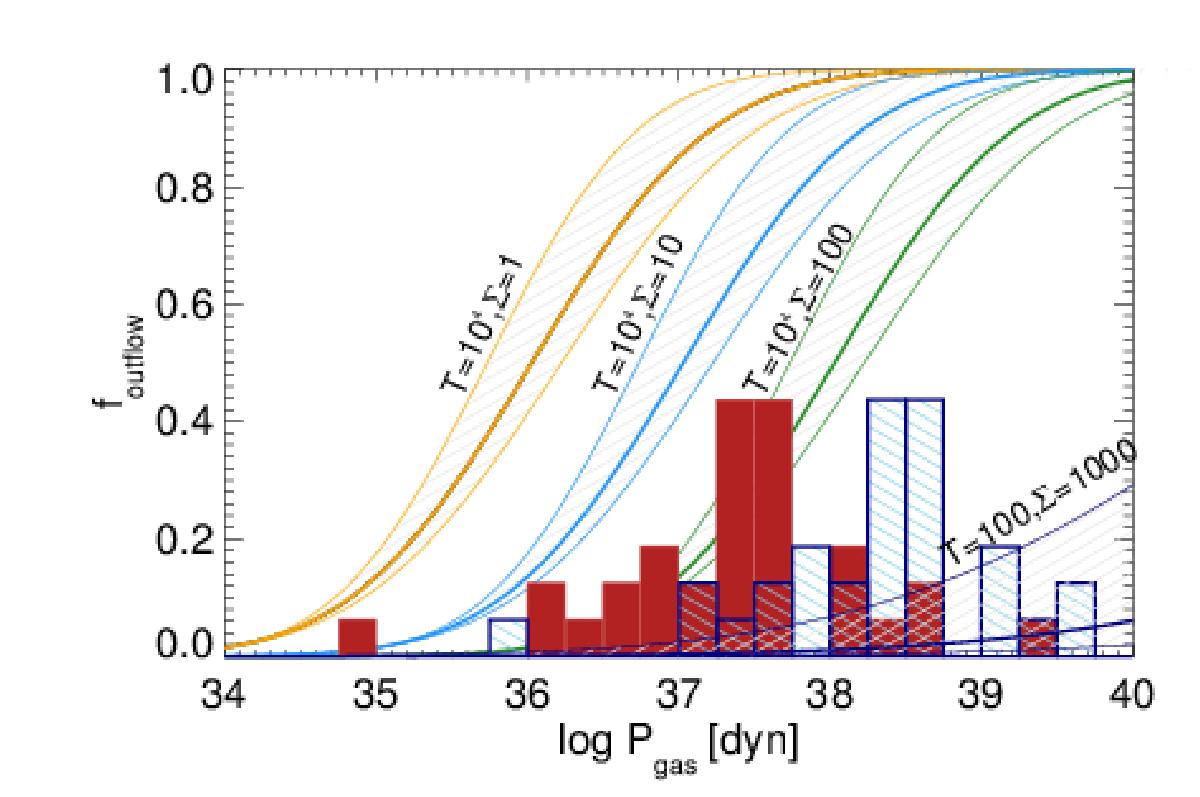
Fraction of gas with densities below the critical value for outflows as a function of the momentum injection, following Hayward & Hopkins (2017). We show three ranges of mass surface density (orange, light blue, and green hatched regions, respectively) with Σ = 1M⊙ pc-2, 10 M⊙ pc-2, and 100 M⊙ pc-2, respectively. For each region, the left, central, and right lines represent turbulent velocities that correspond to FWHM = 500, 800, and 1000 km s-1, respectively. All are given for temperatures of 104 K, corresponding to typical electron temperatures in the warm ionized gas in HzRGs. The red histogram shows the distribution of total gas momentum measured in the galaxies in our sample (Fig. 19). The dark blue region and light blue hatched histogram assume that the total gas content is dominated by molecular and cold neutral gas, with a total gas mass about 10× greater than that of warm ionized gas, T = 1000 K and Σ = 1000M⊙ pc-2.
Current usage metrics show cumulative count of Article Views (full-text article views including HTML views, PDF and ePub downloads, according to the available data) and Abstracts Views on Vision4Press platform.
Data correspond to usage on the plateform after 2015. The current usage metrics is available 48-96 hours after online publication and is updated daily on week days.
Initial download of the metrics may take a while.