Fig. 2
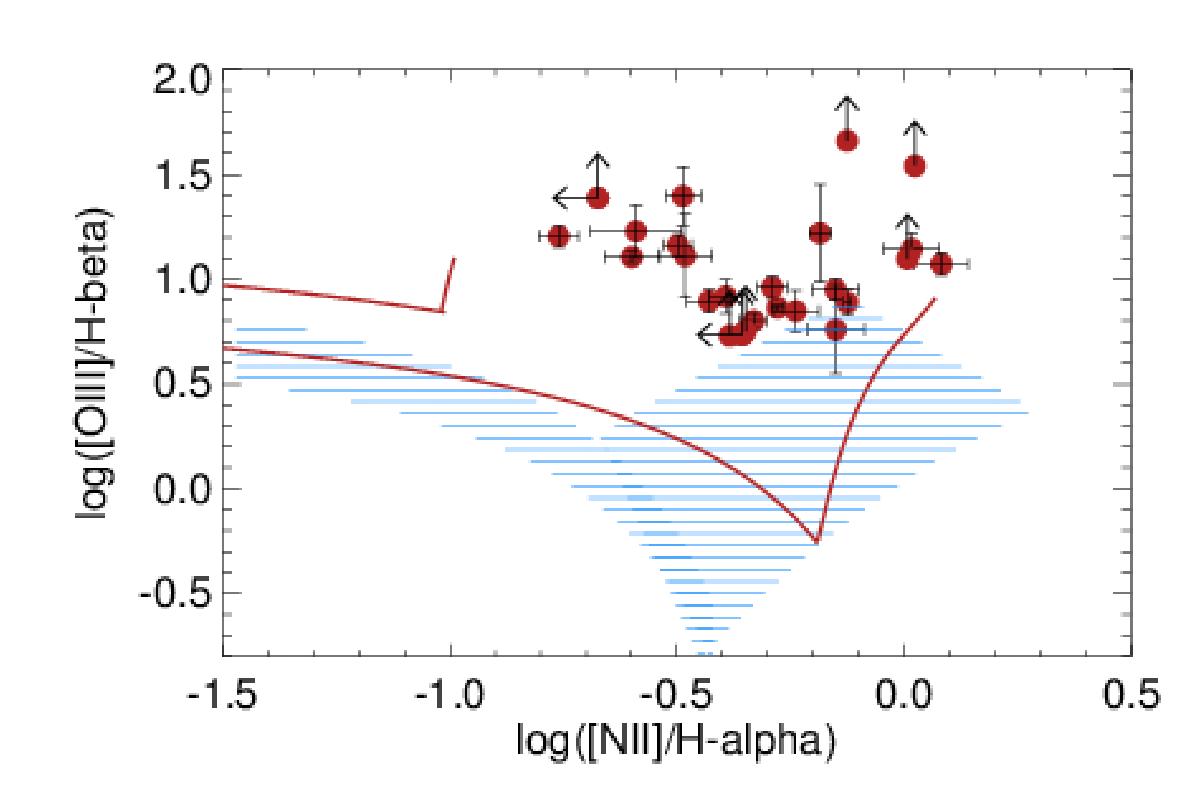
BPT diagram of our sources with two of the models of Kewley et al. (2013a) shown for z = 2.5. Red circles show the 25 radio galaxies from the present analysis and those of Collet et al. (2016), which have measurements of all four lines or sensitive upper limits (on Hβ or [NII]λ6583). We also mark the range of line ratios expected for low-redshift galaxies with ordinary star formation properties and high-metallicity AGN narrow-line regions (light blue hatched region). The red lines show the “high-redshift” starburst region of Kewley et al. (2013a) and the AGN branch with low-metallicity narrow-line regions (their scenario 4).
Current usage metrics show cumulative count of Article Views (full-text article views including HTML views, PDF and ePub downloads, according to the available data) and Abstracts Views on Vision4Press platform.
Data correspond to usage on the plateform after 2015. The current usage metrics is available 48-96 hours after online publication and is updated daily on week days.
Initial download of the metrics may take a while.