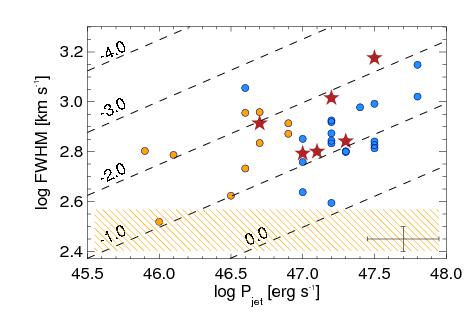
Fig. 17
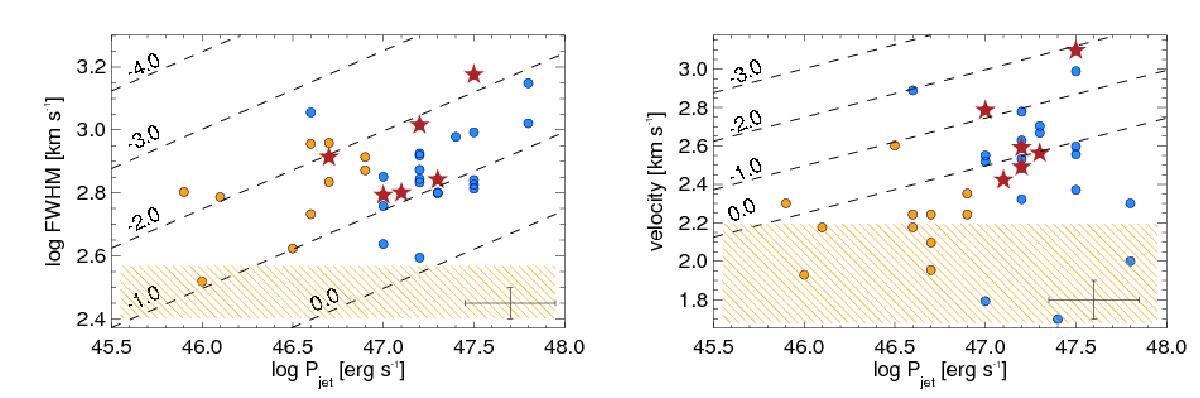
Gas velocity as a function of the jet power following Wagner et al. (2012). The left panel shows FWHM line widths, the right panel approximates a putative radial outflow velocity by showing one half of the measured velocity offsets. Blue and orange symbols show the radio galaxies of the present analysis, and those of Collet et al. (2016), respectively. Red stars show galaxies with measured Eddington ratios from Nesvadba et al. (2011b). The black dashed lines show jet powers corresponding to Eddington ratios between 10-4 and unity. The yellow hatched area shows the range spanned by the mass selected sample of galaxies without prominent radio source of Buitrago et al. (2014).
Current usage metrics show cumulative count of Article Views (full-text article views including HTML views, PDF and ePub downloads, according to the available data) and Abstracts Views on Vision4Press platform.
Data correspond to usage on the plateform after 2015. The current usage metrics is available 48-96 hours after online publication and is updated daily on week days.
Initial download of the metrics may take a while.