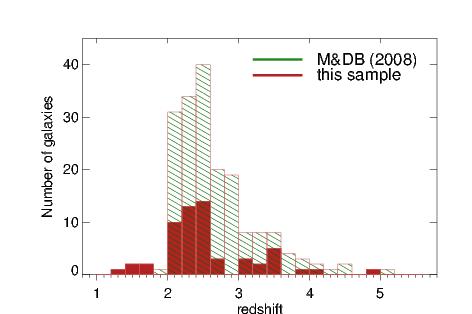
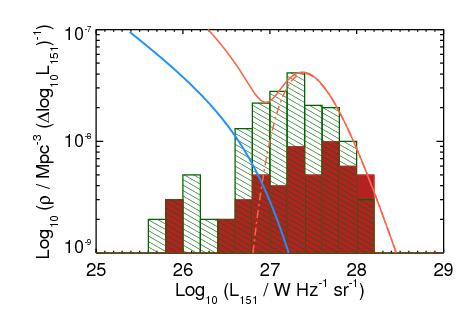
Fig. 1
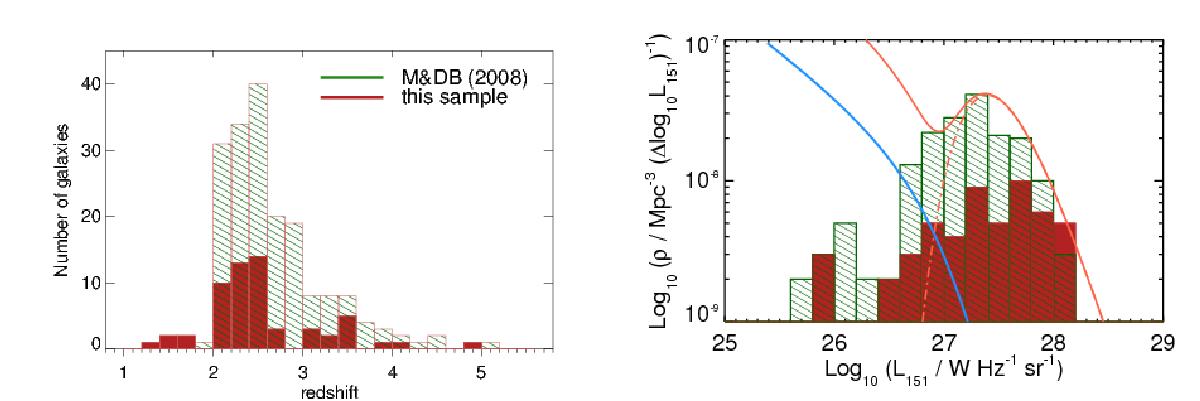
Distribution of our targets in redshift (left) and radio power (right). In both panels, the red solid and dark green hatched histograms show our sample and the parent sample of all known powerful radio galaxies at z ≥ 2 from Miley & De Breuck (2008), respectively. The gap between z = 2.6 and z = 2.9 in the left panel is because no bright optical emission lines fall into the near-infrared atmospheric windows at these redshifts. The light blue and light red lines in the right panel show the luminosity function of powerful radio galaxies at redshifts z = 0 and z = 2 from Willott et al. (2001), respectively. The dot-dashed light red line highlights their high-power “high-z” population (for details see Willott et al. 2001).
Current usage metrics show cumulative count of Article Views (full-text article views including HTML views, PDF and ePub downloads, according to the available data) and Abstracts Views on Vision4Press platform.
Data correspond to usage on the plateform after 2015. The current usage metrics is available 48-96 hours after online publication and is updated daily on week days.
Initial download of the metrics may take a while.