Fig. 8
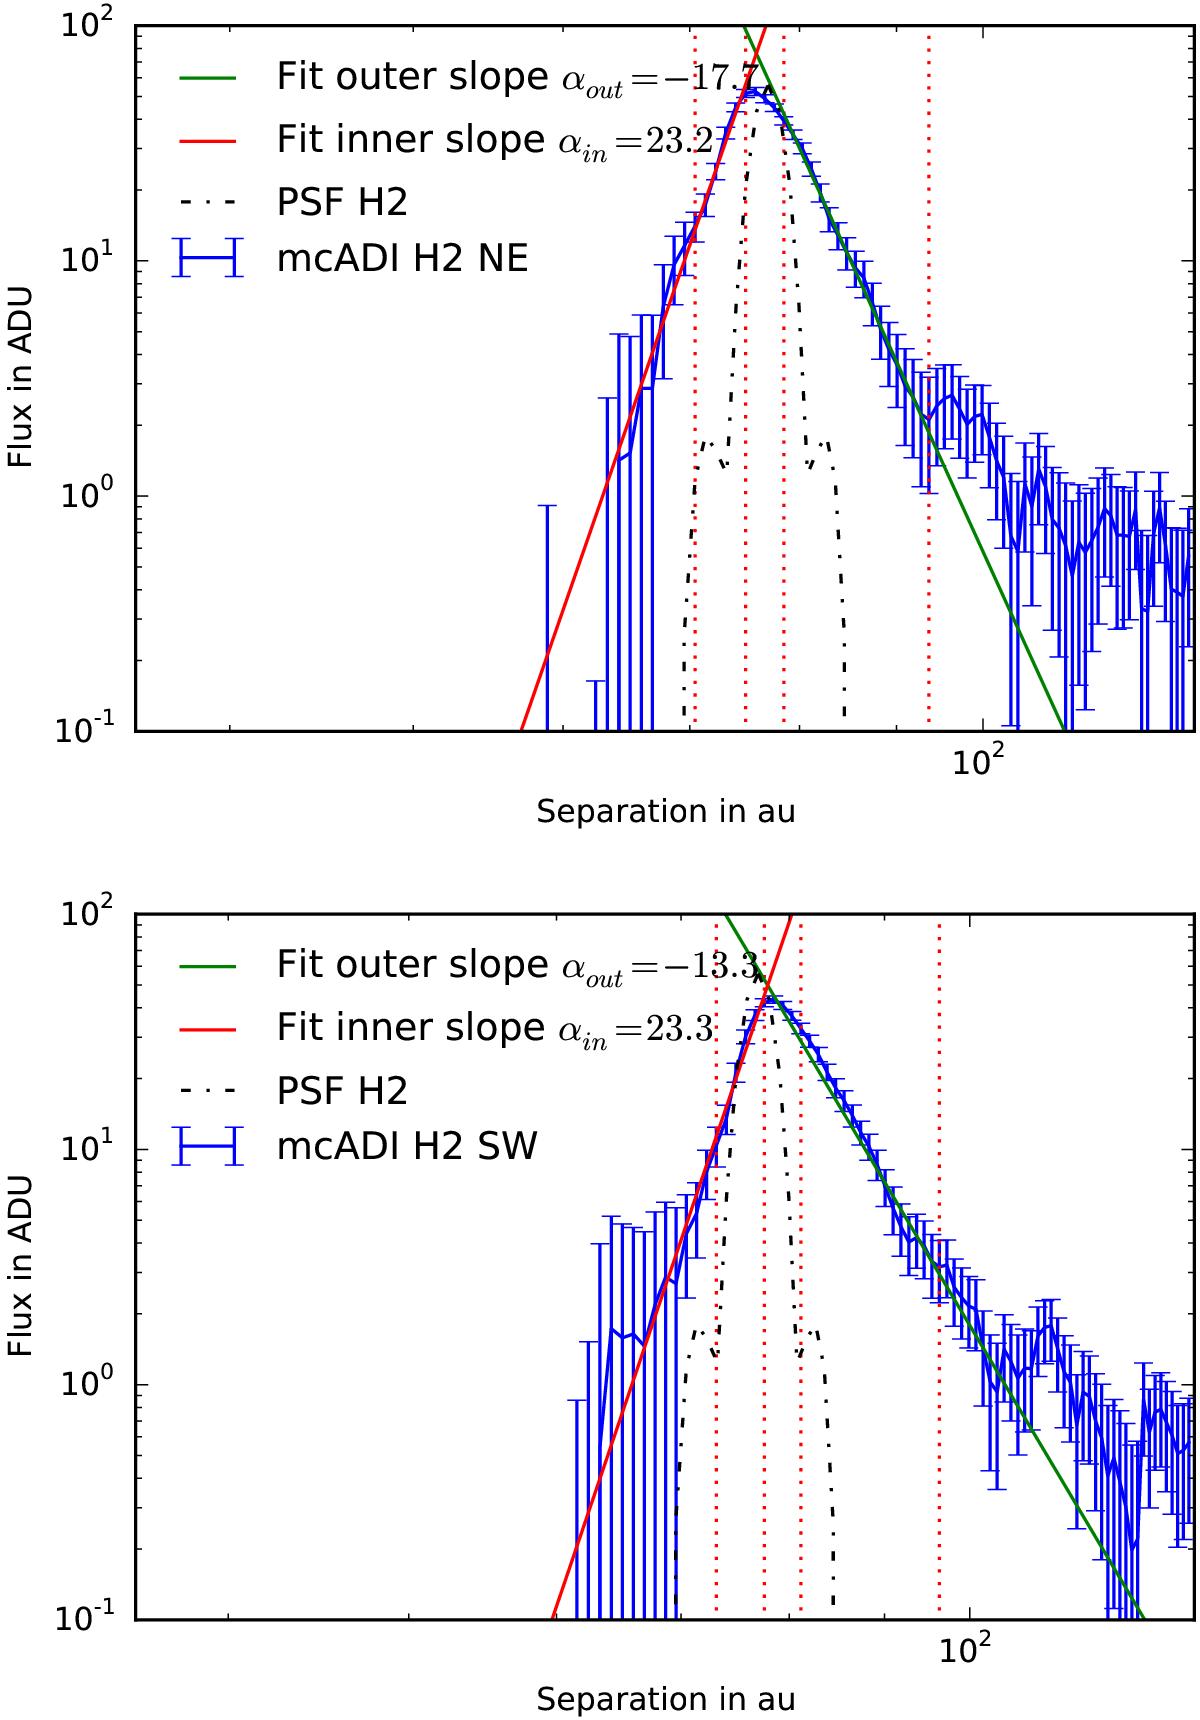
Radial profiles along the semi-major axis of the disc as measured in the H2, mcADI-reduced image. The vertical red dotted lines show the boundary used for the fit of the inner and outer profile with a power law. The profile of the PSF is indicated as a reference. The top image corresponds to the NE ansa and the bottom one to the SW ansa.
Current usage metrics show cumulative count of Article Views (full-text article views including HTML views, PDF and ePub downloads, according to the available data) and Abstracts Views on Vision4Press platform.
Data correspond to usage on the plateform after 2015. The current usage metrics is available 48-96 hours after online publication and is updated daily on week days.
Initial download of the metrics may take a while.