Free Access
Fig. 6
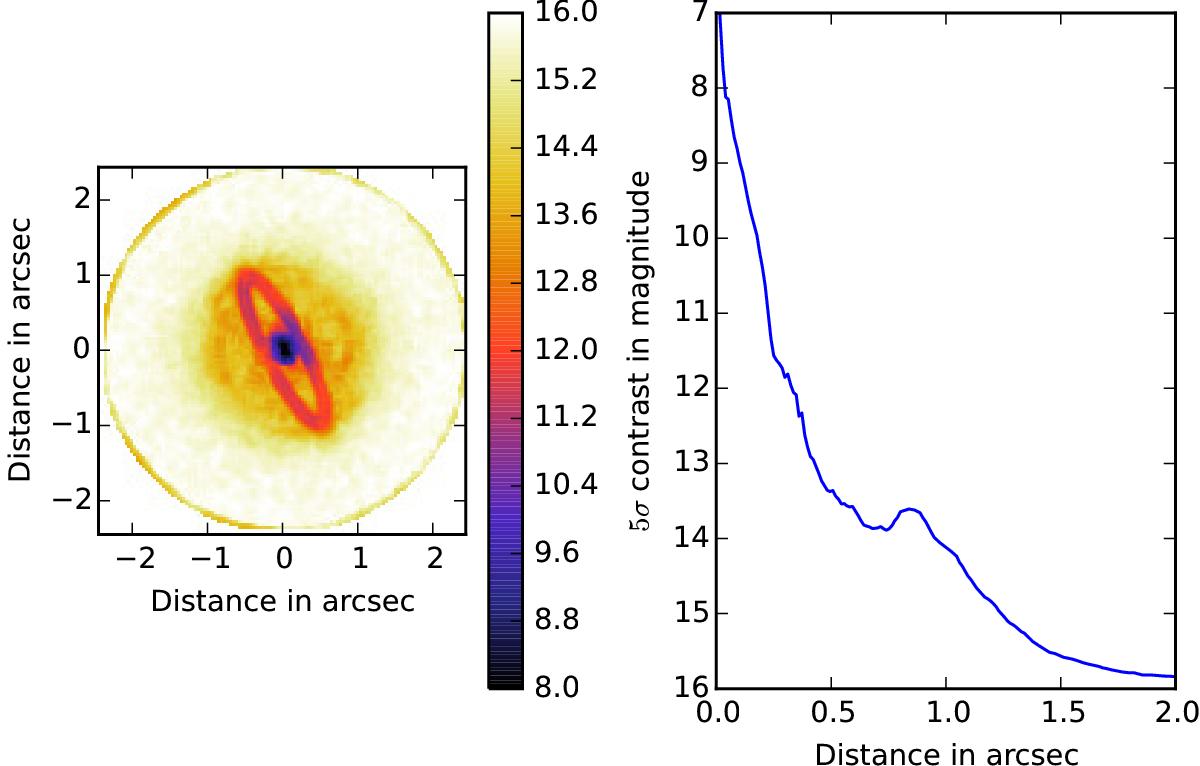
Left: map of the 5σ detection limits expressed in magnitude for IRDIS in the H2 band. Right: azimuthal median of the 2d contrast map displayed on the left. The bump at 0.8′′ is the limit of the correction radius of the adaptive optics system.
Current usage metrics show cumulative count of Article Views (full-text article views including HTML views, PDF and ePub downloads, according to the available data) and Abstracts Views on Vision4Press platform.
Data correspond to usage on the plateform after 2015. The current usage metrics is available 48-96 hours after online publication and is updated daily on week days.
Initial download of the metrics may take a while.