Fig. 5
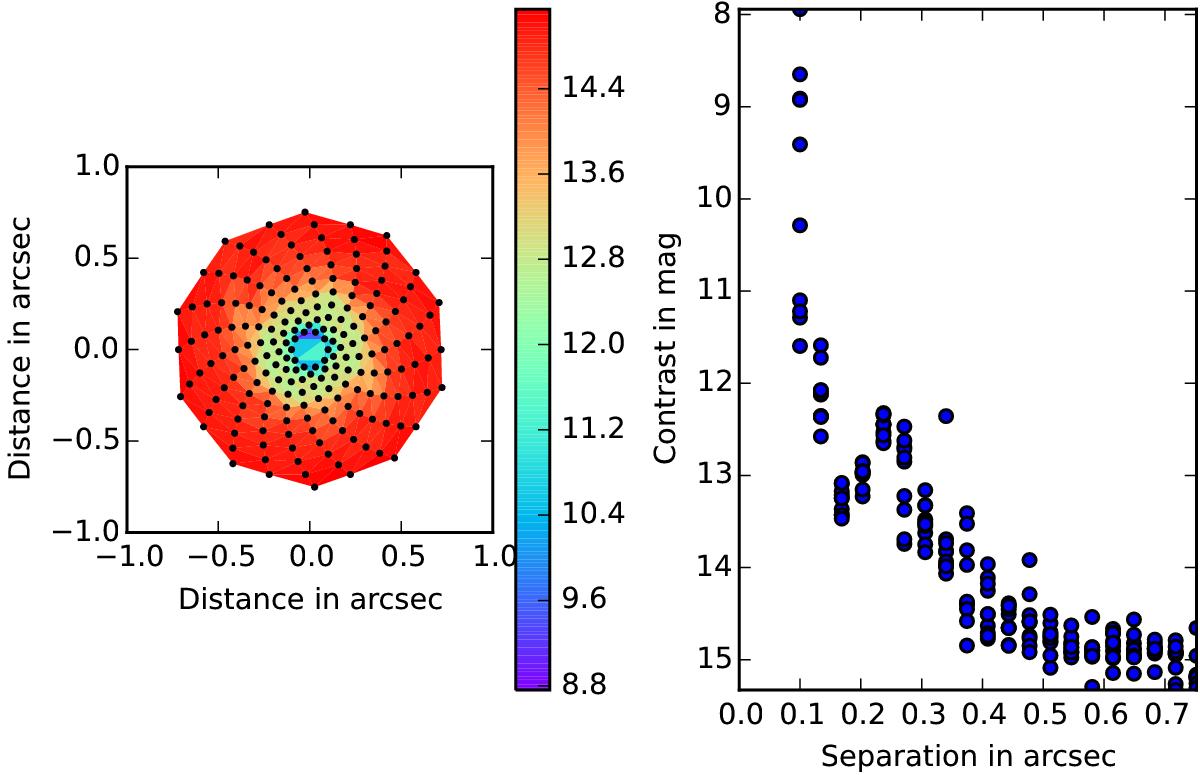
Left: map of the 5σ detection limits expressed in magnitude for the IFS. The detection limits were computed at the position of the black dots, by injecting fake planets as detailed in Vigan et al. (2015). Right: radial curve of the detection limits. Each point corresponds to a fake planet in the left image. The contrast is independent of the wavelength because we assumed a stellar spectrum.
Current usage metrics show cumulative count of Article Views (full-text article views including HTML views, PDF and ePub downloads, according to the available data) and Abstracts Views on Vision4Press platform.
Data correspond to usage on the plateform after 2015. The current usage metrics is available 48-96 hours after online publication and is updated daily on week days.
Initial download of the metrics may take a while.