Fig. 24
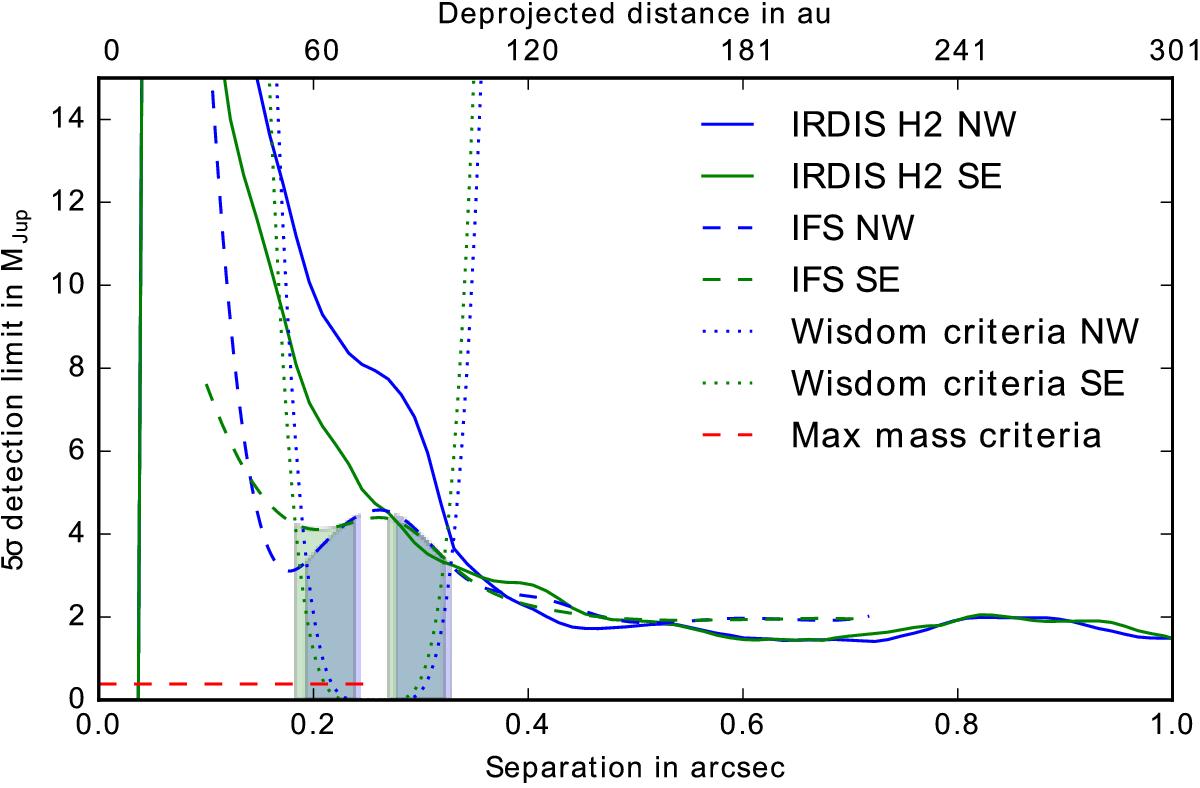
Detection limits in Jupiter mass as a function of the distance to the star along the semi-minor axis of the disc. The blue curves correspond to the NW ansa and the green curve to the SE ansa.The dotted lines show the mass distance relationship of a planet shaping the edge of the disc. The shaded area represents the region in the (Mpl, apl) parameter space compatible with a planet shepherding the disc, given the sensitivity of our new measurements along the semi-minor axis.
Current usage metrics show cumulative count of Article Views (full-text article views including HTML views, PDF and ePub downloads, according to the available data) and Abstracts Views on Vision4Press platform.
Data correspond to usage on the plateform after 2015. The current usage metrics is available 48-96 hours after online publication and is updated daily on week days.
Initial download of the metrics may take a while.