Fig. 7
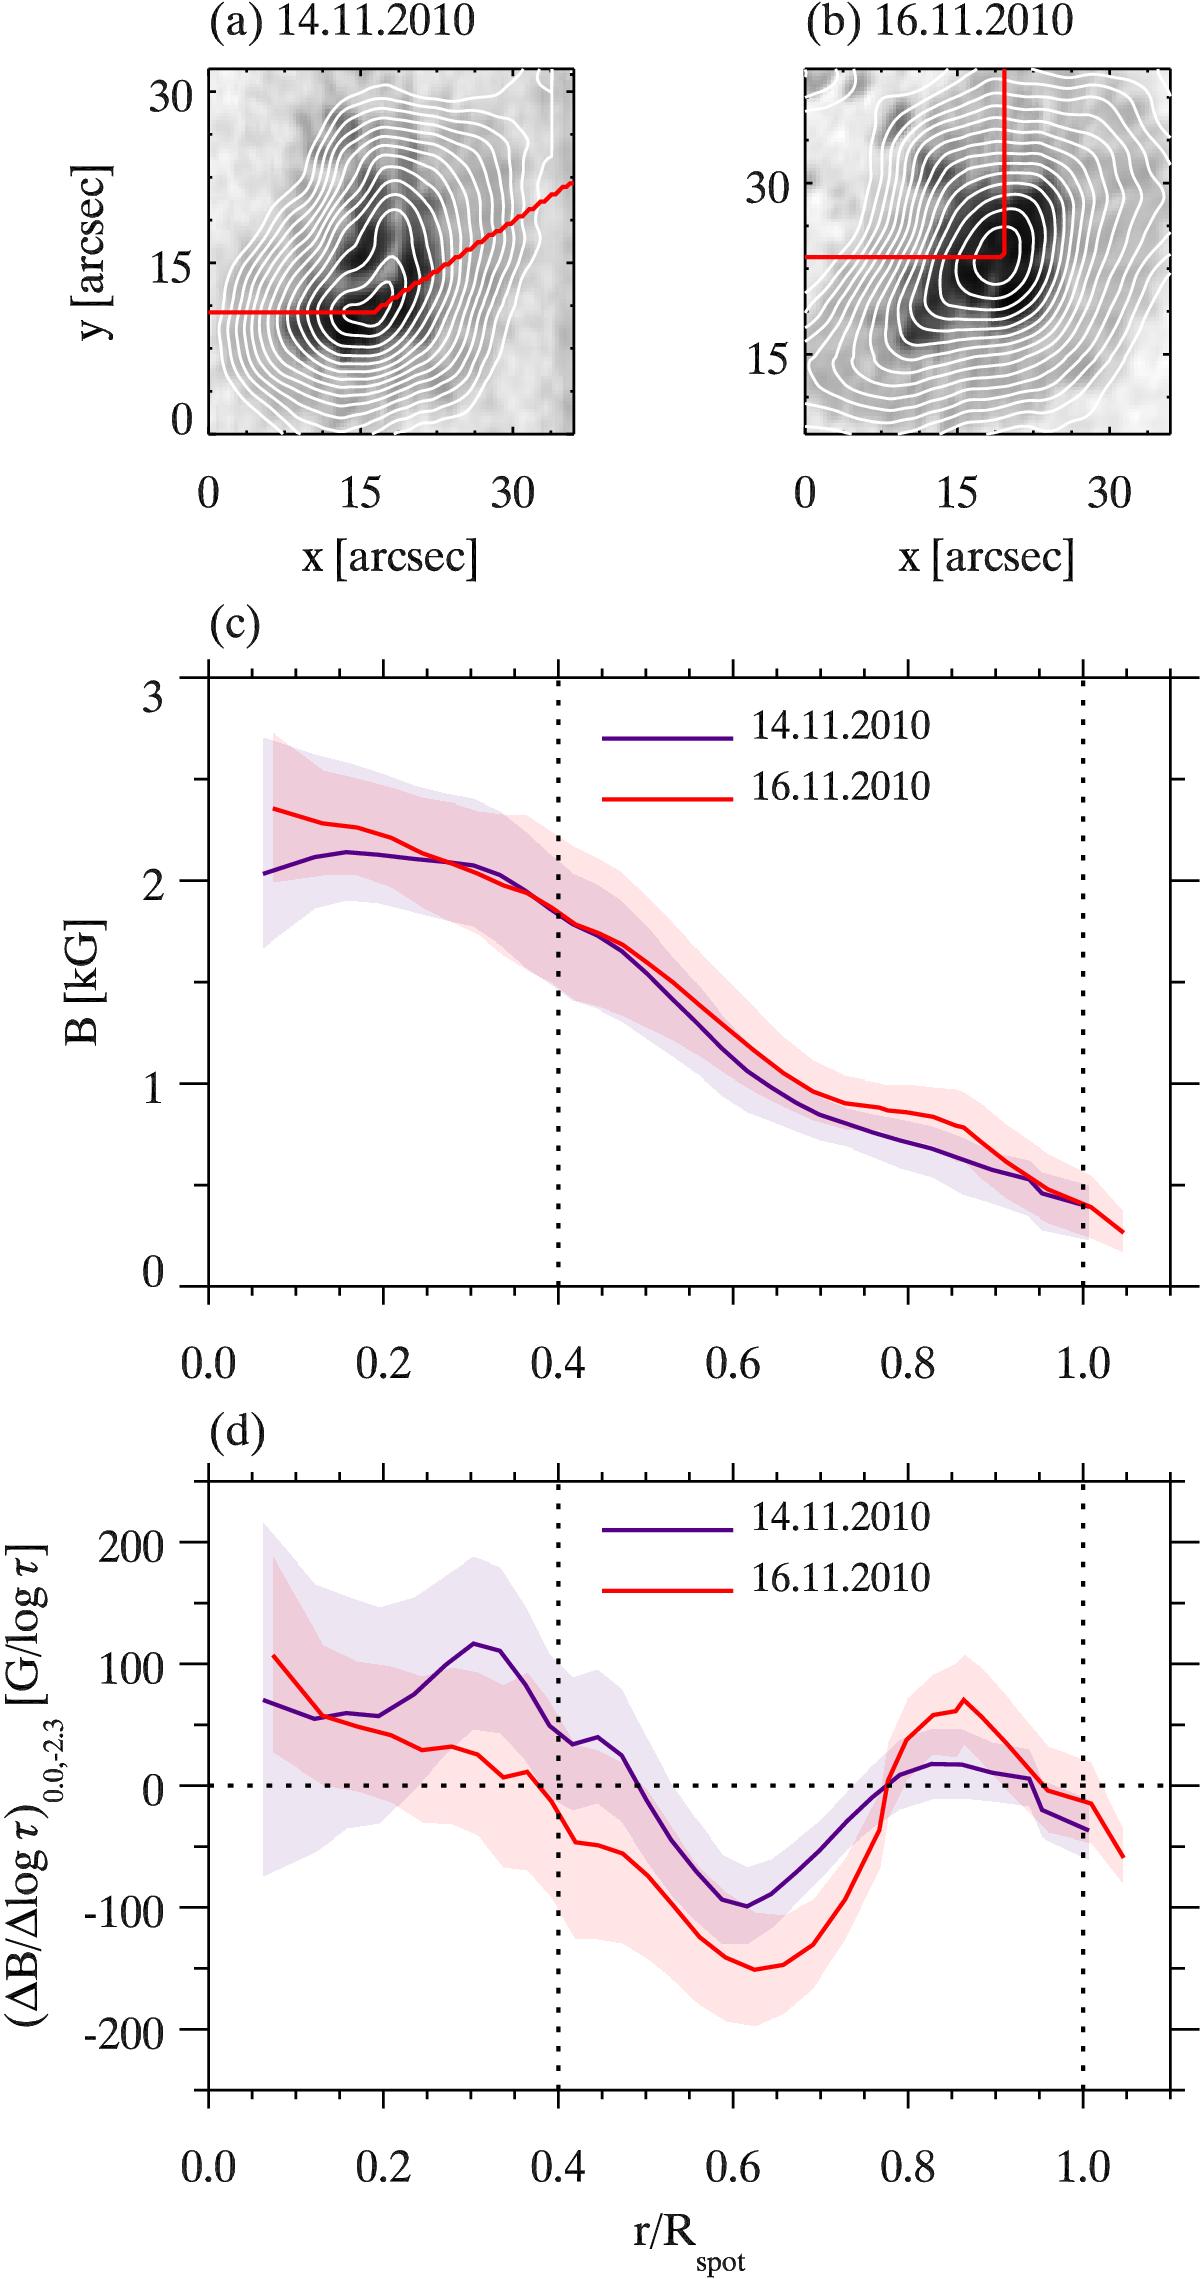
Continuum intensity maps from 14 November 2010 (panel a)) and 16 November 2010 (panel b)). The contours are used to calculate azimuthal averages. The areas above the red lines were neglected because of the complex structure of the sunspot there. Azimuthally averaged parameters: Panel c) shows the radial dependence of B of the sunspot observed on 14 November 2010 (violet curve) and 16 November 2010 (red curve) with VTT/TIP-2. Panel d) represents the vertical gradient of the magnetic field strength (ΔB/ Δlog τ)0.0,−2.3 as a function of r/Rspot. Shaded areas represent standard deviations. Dotted vertical lines in panels c) and d) indicate the averaged location of the umbra-penumbra boundary and the outer boundary of the sunspot.
Current usage metrics show cumulative count of Article Views (full-text article views including HTML views, PDF and ePub downloads, according to the available data) and Abstracts Views on Vision4Press platform.
Data correspond to usage on the plateform after 2015. The current usage metrics is available 48-96 hours after online publication and is updated daily on week days.
Initial download of the metrics may take a while.