Fig. 24
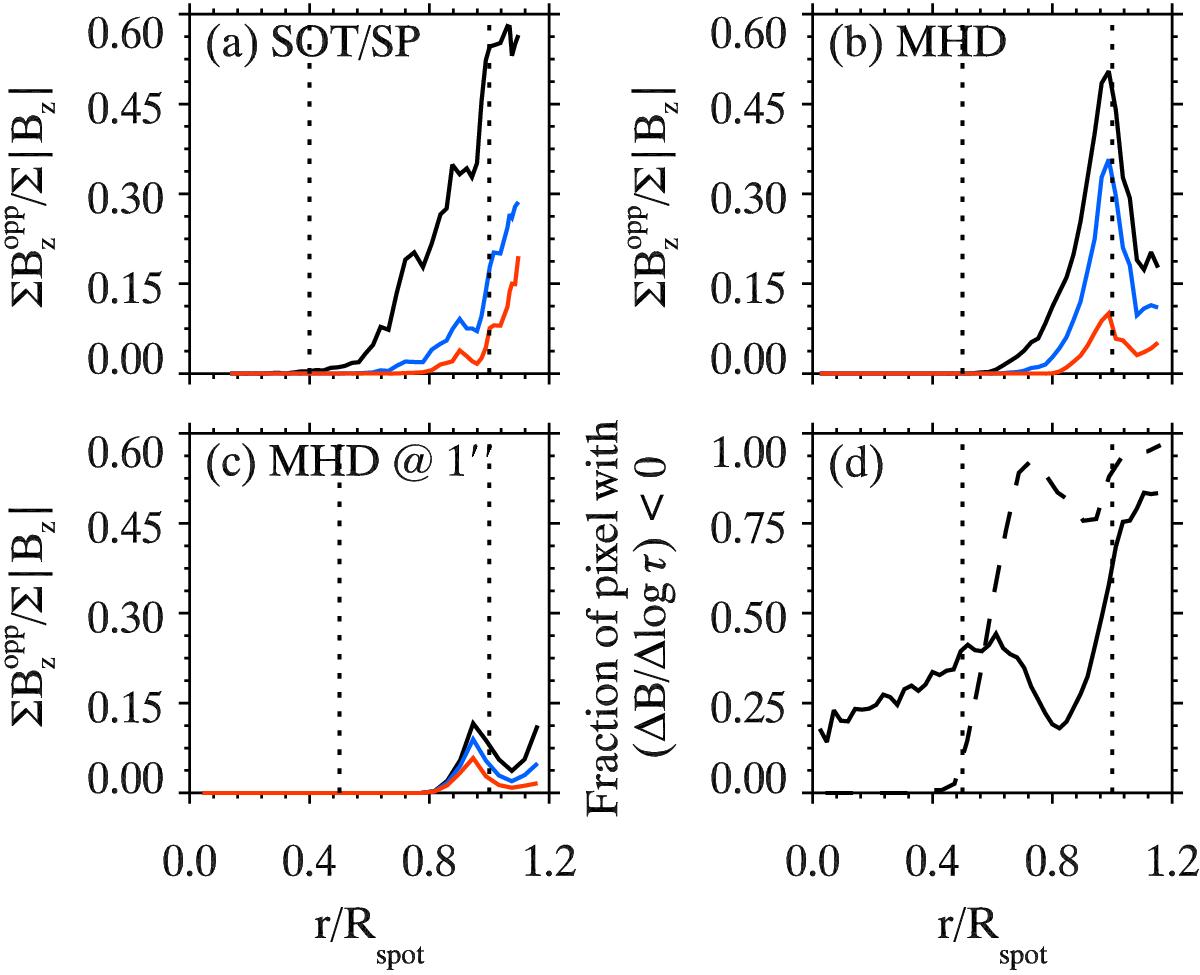
Panel a) shows the radial distribution of opposite polarity flux ![]() as a fraction of the net flux |Bz| from the SOT/SP observations. Panel b) displays the radial distribution of opposite polarity flux for the MHD simulation. Panel c) corresponds to opposite flux from inversions of synthesized Stokes profiles from the MHD simulation which was degraded with a Gaussian of
as a fraction of the net flux |Bz| from the SOT/SP observations. Panel b) displays the radial distribution of opposite polarity flux for the MHD simulation. Panel c) corresponds to opposite flux from inversions of synthesized Stokes profiles from the MHD simulation which was degraded with a Gaussian of ![]() width. Black, blue, and red curves correspond to log τ = 0.0, log τ = −0.9, and log τ = −2.5, respectively. Solid and dashed curves in panel (d) display the numbers of pixels where (ΔB/ Δlog τ)0.0,−2.3 < 0 at native and degraded spatial resolution in the MHD simulation, respectively. Dotted vertical lines in all the panels indicate the umbra-penumbra boundary and the outer boundary of the sunspot.
width. Black, blue, and red curves correspond to log τ = 0.0, log τ = −0.9, and log τ = −2.5, respectively. Solid and dashed curves in panel (d) display the numbers of pixels where (ΔB/ Δlog τ)0.0,−2.3 < 0 at native and degraded spatial resolution in the MHD simulation, respectively. Dotted vertical lines in all the panels indicate the umbra-penumbra boundary and the outer boundary of the sunspot.
Current usage metrics show cumulative count of Article Views (full-text article views including HTML views, PDF and ePub downloads, according to the available data) and Abstracts Views on Vision4Press platform.
Data correspond to usage on the plateform after 2015. The current usage metrics is available 48-96 hours after online publication and is updated daily on week days.
Initial download of the metrics may take a while.