Fig. 21
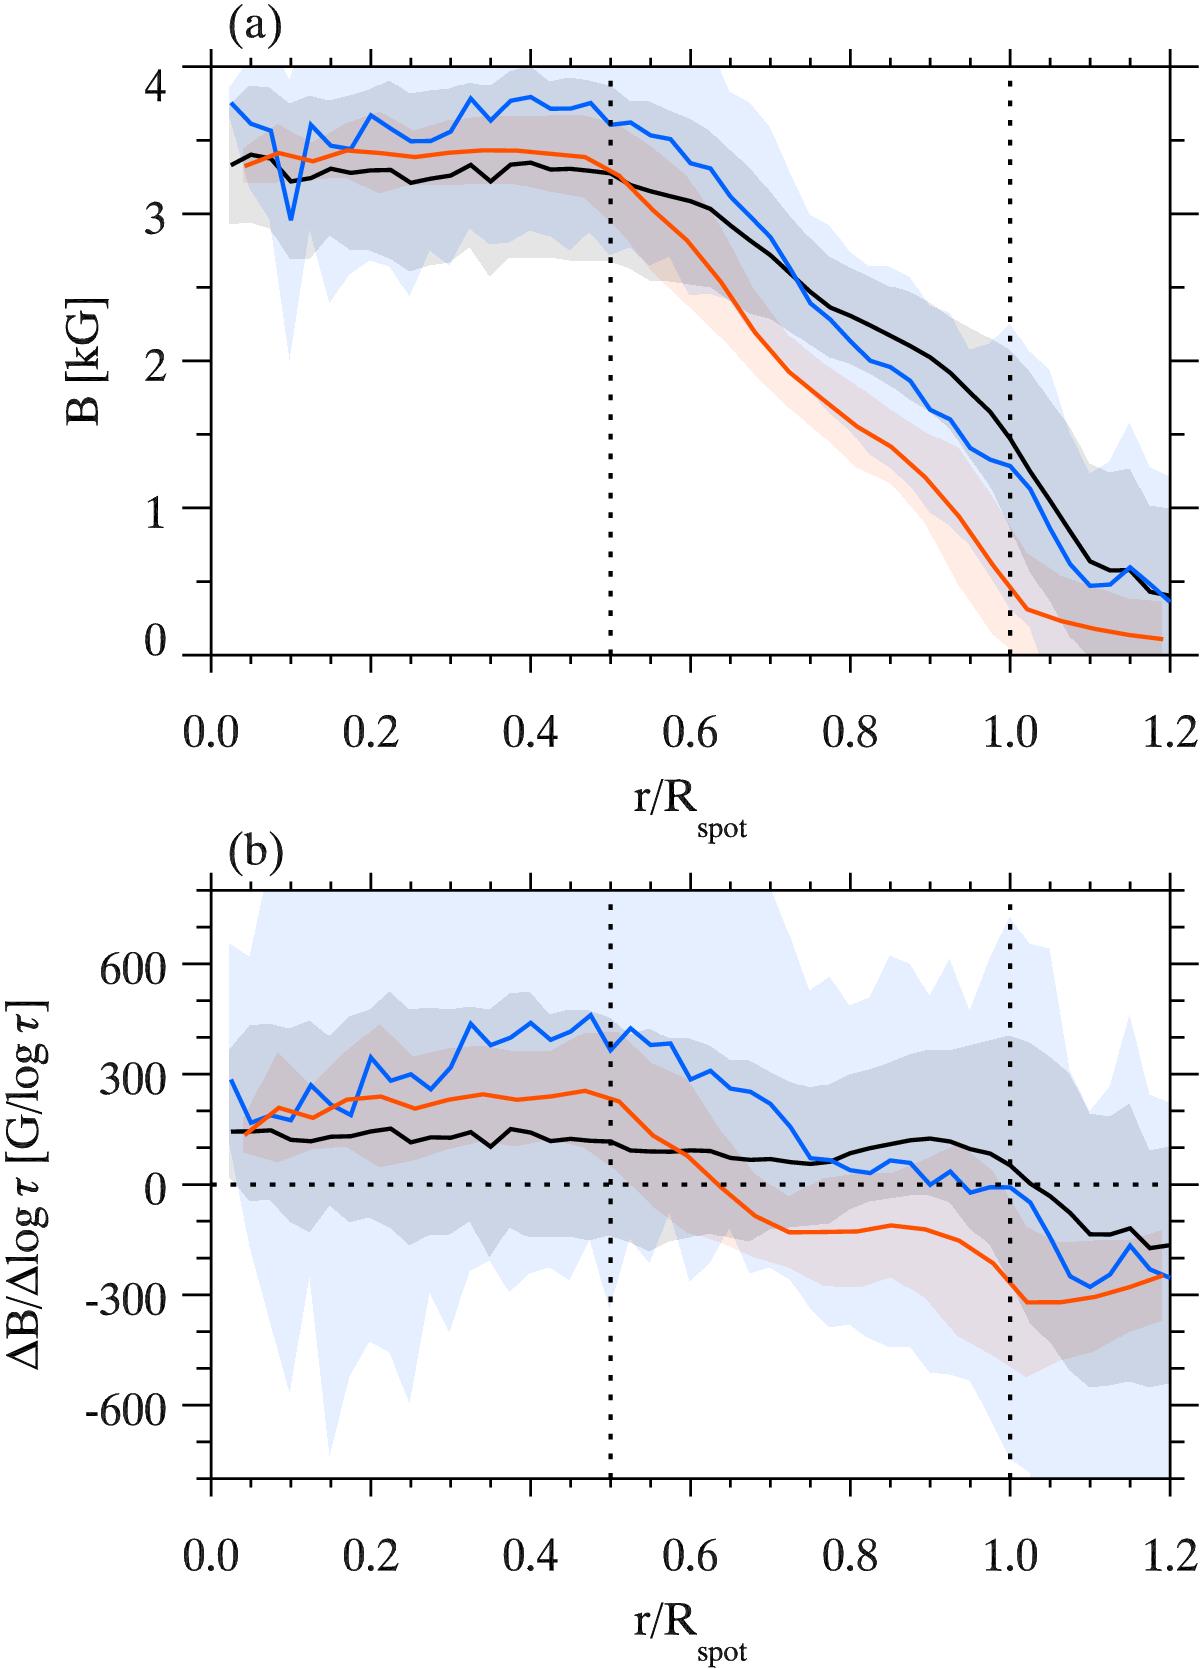
Radial dependence of B at log τ = 0 (panel a)) and (ΔB/ Δlog τ)0.0,−2.3 (panel b)) from the MHD simulation. Black curves are estimated directly from the MHD simulation and blue curves are the results of inversions of synthesized Stokes profiles from the MHD simulation at native resolution. Red curves are from inversions of synthesized Stokes profiles from the MHD simulation degraded to a spatial resolution of ![]() . Shaded areas represent standard deviation. The dotted vertical lines in both panels indicate the umbra-penumbra boundary and the outer boundary of the sunspot.
. Shaded areas represent standard deviation. The dotted vertical lines in both panels indicate the umbra-penumbra boundary and the outer boundary of the sunspot.
Current usage metrics show cumulative count of Article Views (full-text article views including HTML views, PDF and ePub downloads, according to the available data) and Abstracts Views on Vision4Press platform.
Data correspond to usage on the plateform after 2015. The current usage metrics is available 48-96 hours after online publication and is updated daily on week days.
Initial download of the metrics may take a while.