Fig. 20
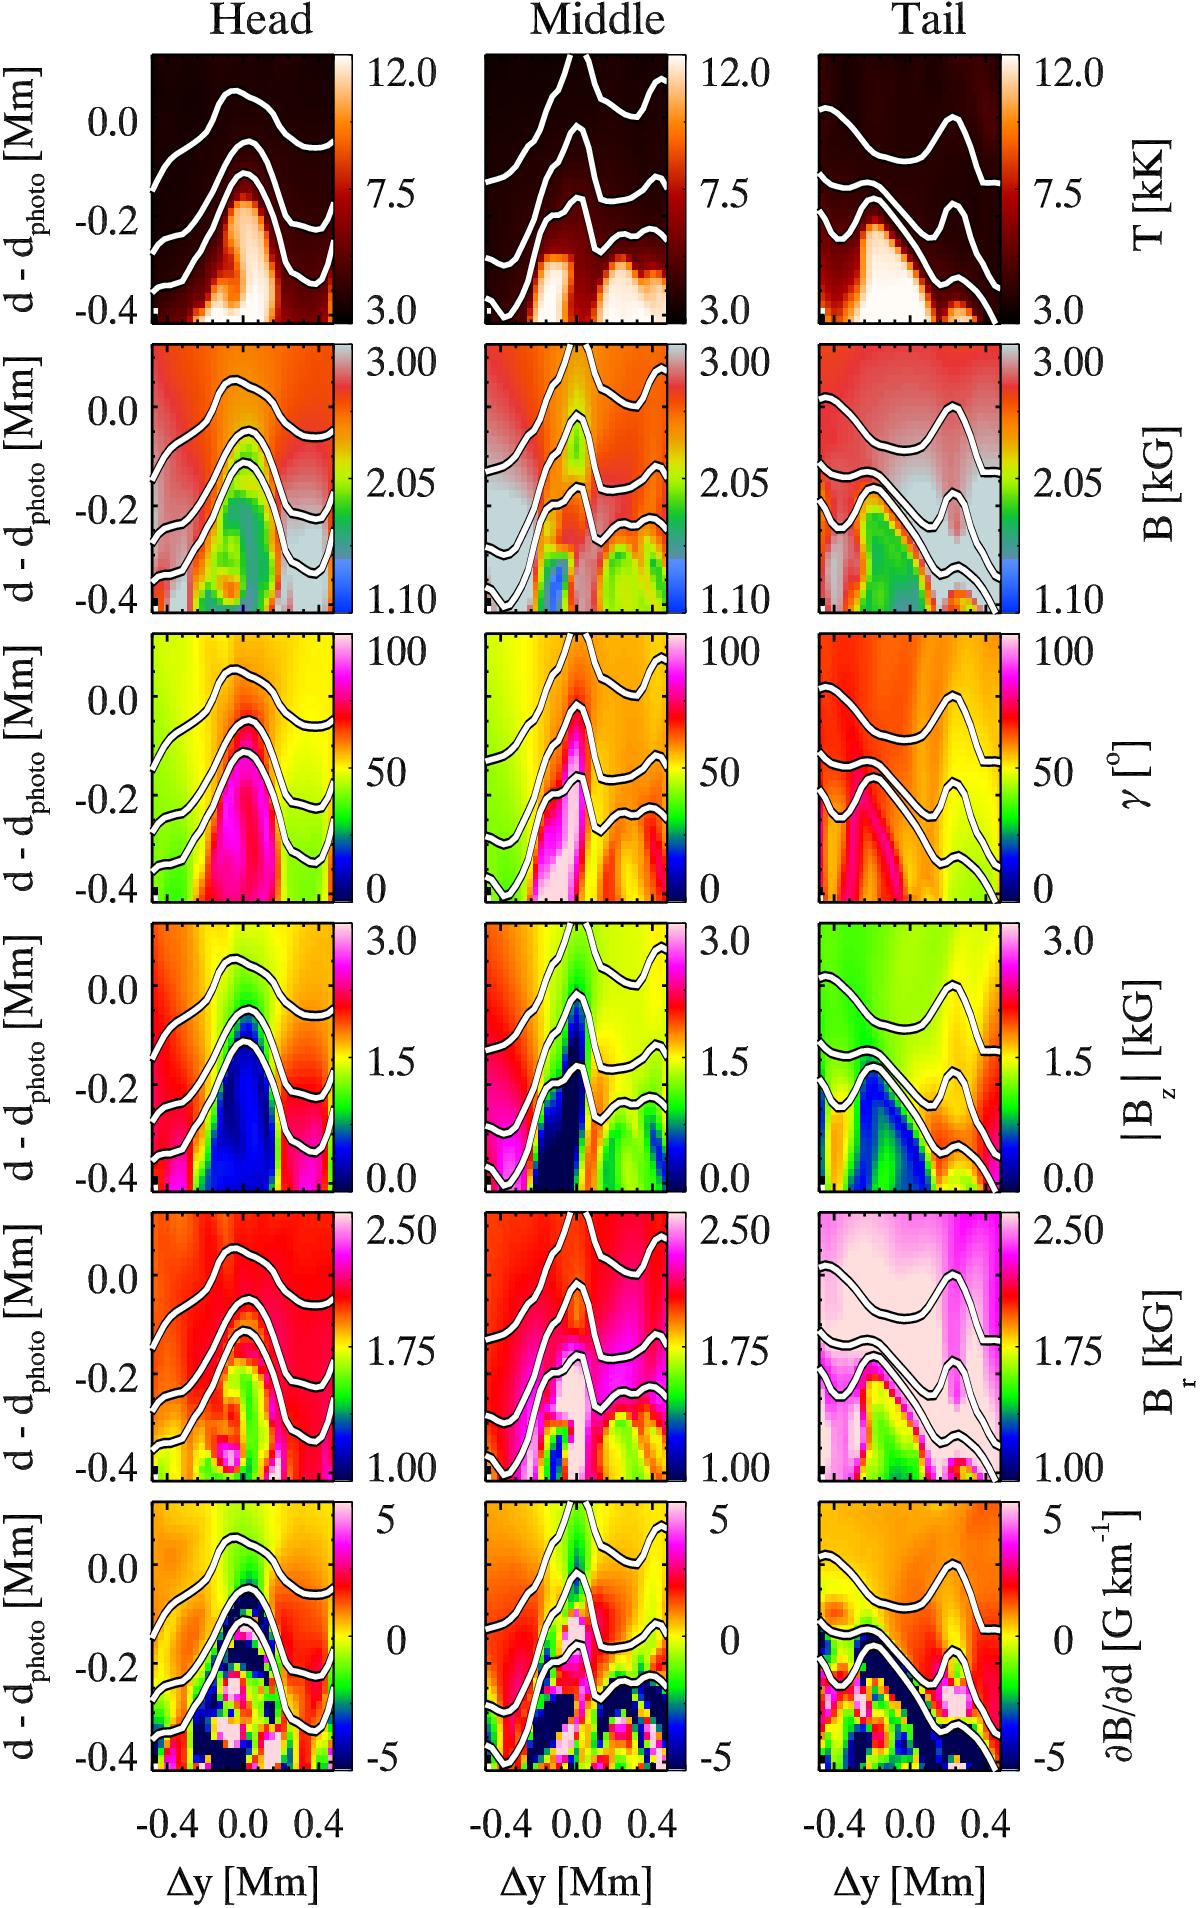
Geometrical depth stratification of various physical parameters perpendicular to the axis of a filament in the MHD simulation. The locations of the plotted cuts are indicated by red bars in Fig. 18a. Panels in the first, second, and third column represent the head, middle, and tail of the filament, respectively. From top to bottom (for each column): T, B, γ, | Bz |, Br, and ∂B/∂d are plotted. Lower, middle, and upper white curves in all panels show log τ = 0.0,−0.9,−2.5 levels, respectively.
Current usage metrics show cumulative count of Article Views (full-text article views including HTML views, PDF and ePub downloads, according to the available data) and Abstracts Views on Vision4Press platform.
Data correspond to usage on the plateform after 2015. The current usage metrics is available 48-96 hours after online publication and is updated daily on week days.
Initial download of the metrics may take a while.