Free Access
Fig. 18
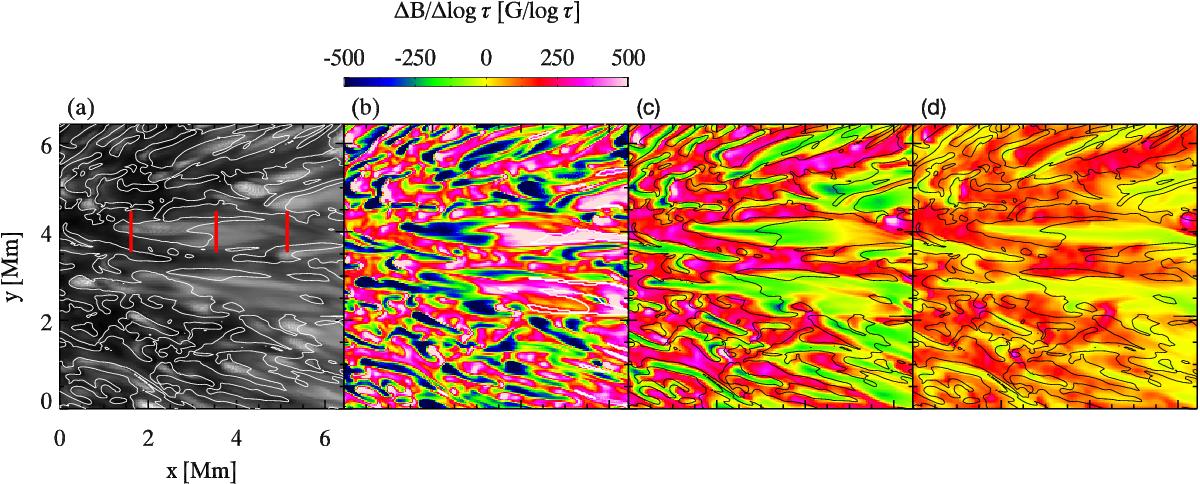
Blowups of the area within the white boxes in Fig. 17. Contours in panels a); c); and d) encircles negative (ΔB/ Δlog τ)0.0,−0.9 and white contours in panel b) indicate areas with polarity opposite to that in the umbra. The three vertical bars in panel a) mark the locations of the vertical cuts displayed in Fig. 20.
Current usage metrics show cumulative count of Article Views (full-text article views including HTML views, PDF and ePub downloads, according to the available data) and Abstracts Views on Vision4Press platform.
Data correspond to usage on the plateform after 2015. The current usage metrics is available 48-96 hours after online publication and is updated daily on week days.
Initial download of the metrics may take a while.