Fig. 16
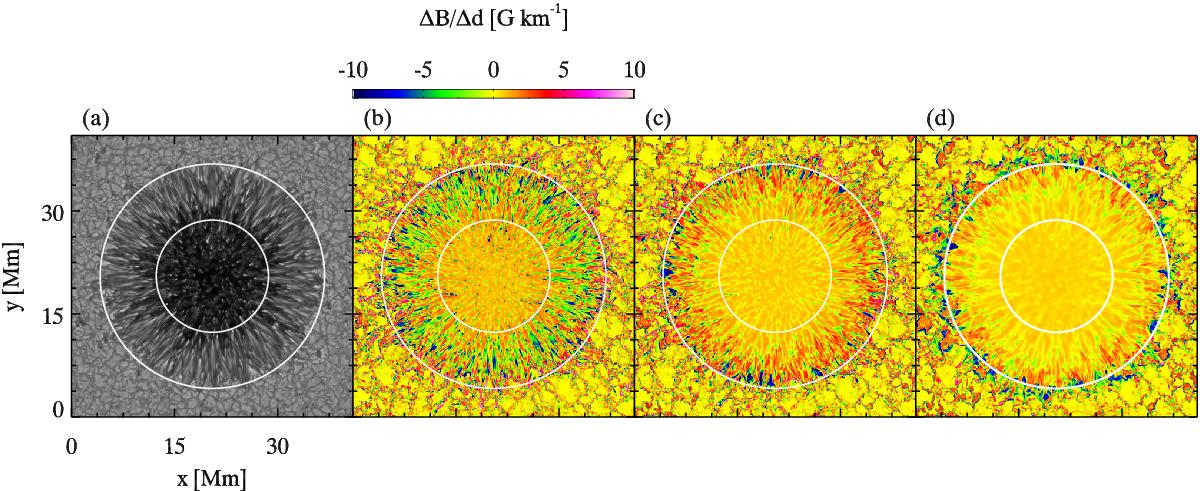
Continuum intensity (panel a) and the magnetic field gradient maps from a 3D MHD simulation of a sunspot computed by Rempel (2012). Panels b–d) depict (ΔB/ Δd) estimated between d−dphoto = 384 km and 192 km, d−dphoto = 192 km and 0 km, and d−dphoto = 0 km and –192 km, respectively. Here dphoto signifies the depth at which on average τ = 0 is reached in the quiet Sun. White circles in all panels represent the averaged umbra-penumbra boundary and the outer boundary of the sunspot.
Current usage metrics show cumulative count of Article Views (full-text article views including HTML views, PDF and ePub downloads, according to the available data) and Abstracts Views on Vision4Press platform.
Data correspond to usage on the plateform after 2015. The current usage metrics is available 48-96 hours after online publication and is updated daily on week days.
Initial download of the metrics may take a while.