Fig. 15
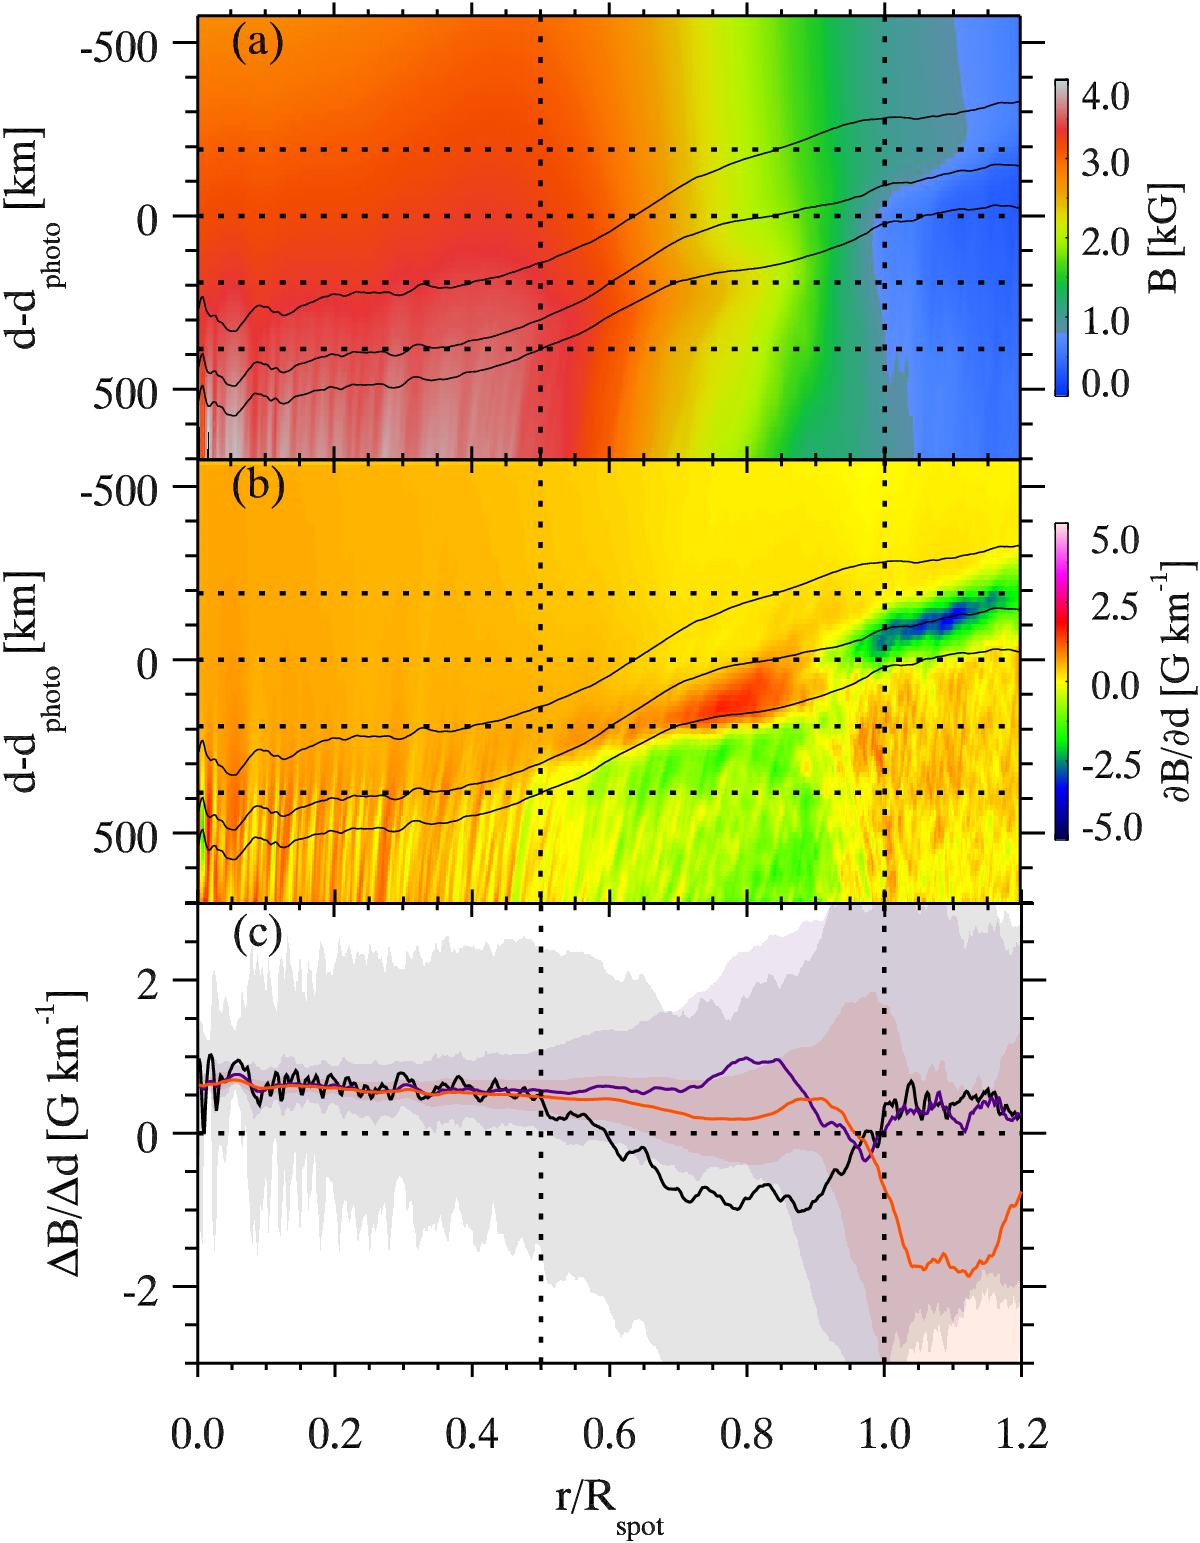
Azimuthally averaged magnetic field and its vertical gradient in the 3D MHD simulation. Panel a) represents the magnetic field as a function of normalized radial distance r/Rspot and geometrical depth d−dphoto, where dphoto denotes the average geometrical depth of the quiet Sun photosphere at log τ = 0. Panel b) displays ∂B/∂d. The lower, middle, and upper curves in panels a) and b) show the log τ = 0.0, log τ = −0.9, and log τ = −2.5 levels, respectively. The black, blue, and red curves in panel c) depict (ΔB/ Δd) estimated between d−dphoto = 384 km and 192 km, d−dphoto = 192 km and 0 km, and d−dphoto = 0 km and –192 km, respectively. These geometric depth positions used in estimating (ΔB/ Δd) are shown by horizontal lines in panels a) and b). Shaded areas represent standard deviations. Dotted vertical lines in all panels indicate the umbra-penumbra boundary and the outer boundary of the sunspot.
Current usage metrics show cumulative count of Article Views (full-text article views including HTML views, PDF and ePub downloads, according to the available data) and Abstracts Views on Vision4Press platform.
Data correspond to usage on the plateform after 2015. The current usage metrics is available 48-96 hours after online publication and is updated daily on week days.
Initial download of the metrics may take a while.