Fig. 10
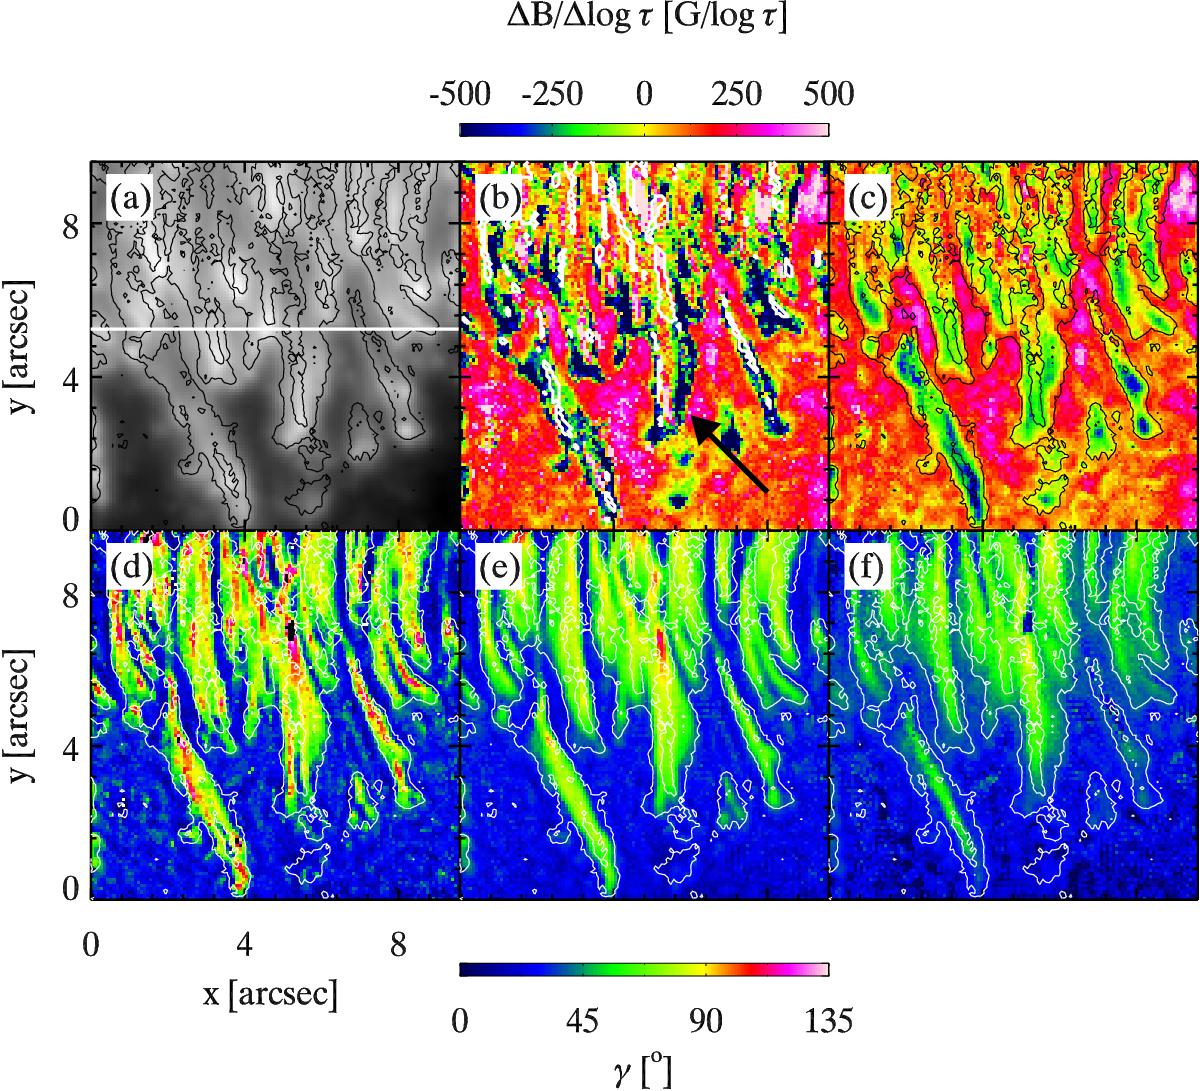
a)−c): Same as Fig. 8, but showing only the area within the white box in panel a) of Fig. 8. Additional panels d), e), and f) display the inclination of the magnetic field at log τ = 0.0,−0.9,−2.5, respectively. Contours in panels a); c); d); e); and f) separate patches of negative and positive (ΔB/ Δlog τ)0.0,−0.9 and white contours in panel b) indicate areas of polarity opposite to that in the umbra at log τ = 0.0. The horizontal white line in panel a) indicates the location of the cut plotted in Fig. 14. The black arrow in panel b) marks an example of a penumbral filament with negative (ΔB/ Δlog τ)0.0,−0.9 at its edges.
Current usage metrics show cumulative count of Article Views (full-text article views including HTML views, PDF and ePub downloads, according to the available data) and Abstracts Views on Vision4Press platform.
Data correspond to usage on the plateform after 2015. The current usage metrics is available 48-96 hours after online publication and is updated daily on week days.
Initial download of the metrics may take a while.