Fig. 1
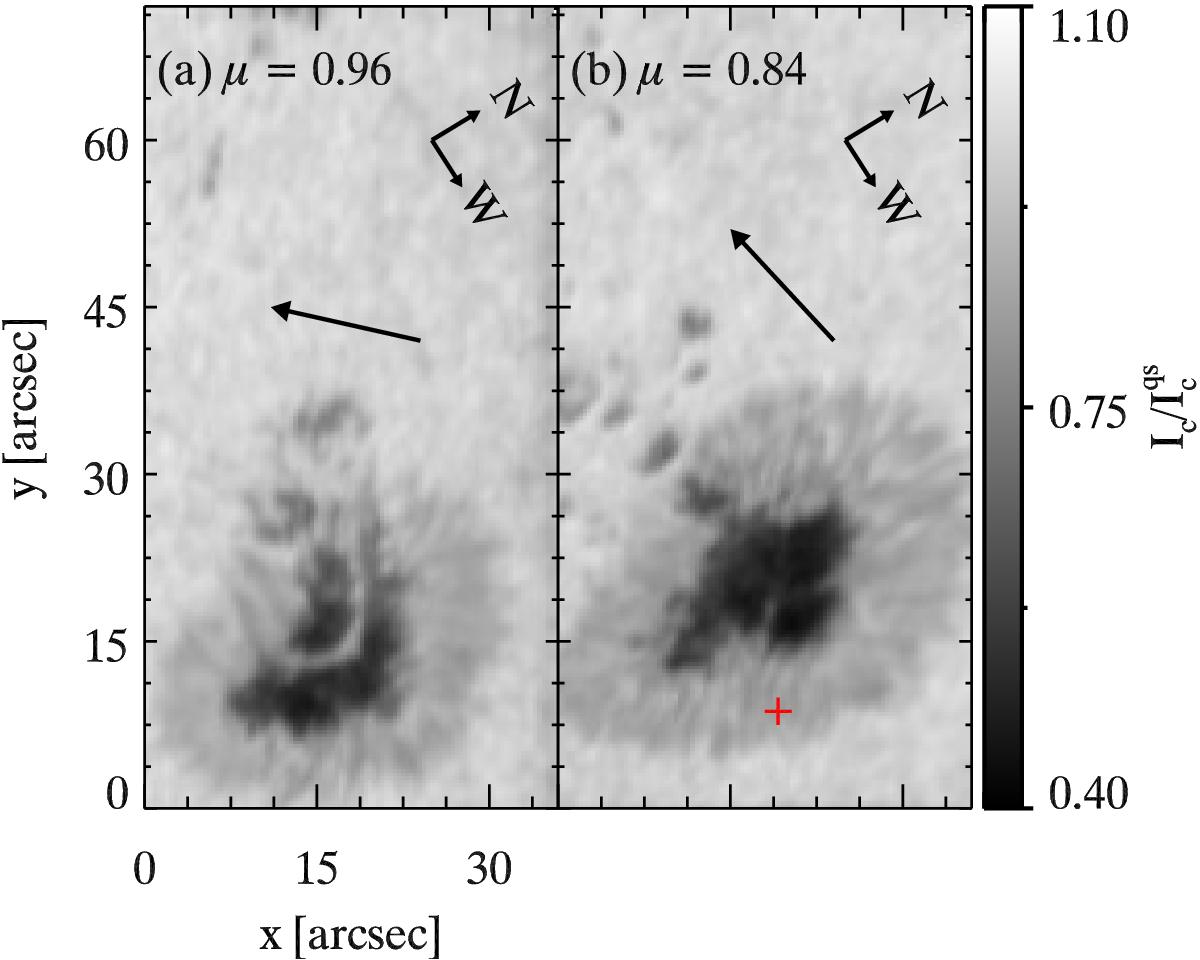
a) Normalized continuum intensity ![]() map of the observed sunspot in AR NOAA 11124 observed on 14 November 2010, obtained from VTT/TIP-2 data. Ic denotes the continuum intensity and
map of the observed sunspot in AR NOAA 11124 observed on 14 November 2010, obtained from VTT/TIP-2 data. Ic denotes the continuum intensity and ![]() is the averaged quiet Sun continuum intensity. b)
is the averaged quiet Sun continuum intensity. b) ![]() map of the same sunspot observed on 16 November 2010. Arrows in both maps indicate the direction to disk center. Solar north and west directions are marked by arrows in the upper right of each panel.
map of the same sunspot observed on 16 November 2010. Arrows in both maps indicate the direction to disk center. Solar north and west directions are marked by arrows in the upper right of each panel.
Current usage metrics show cumulative count of Article Views (full-text article views including HTML views, PDF and ePub downloads, according to the available data) and Abstracts Views on Vision4Press platform.
Data correspond to usage on the plateform after 2015. The current usage metrics is available 48-96 hours after online publication and is updated daily on week days.
Initial download of the metrics may take a while.