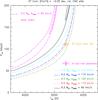
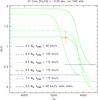
Fig. 9
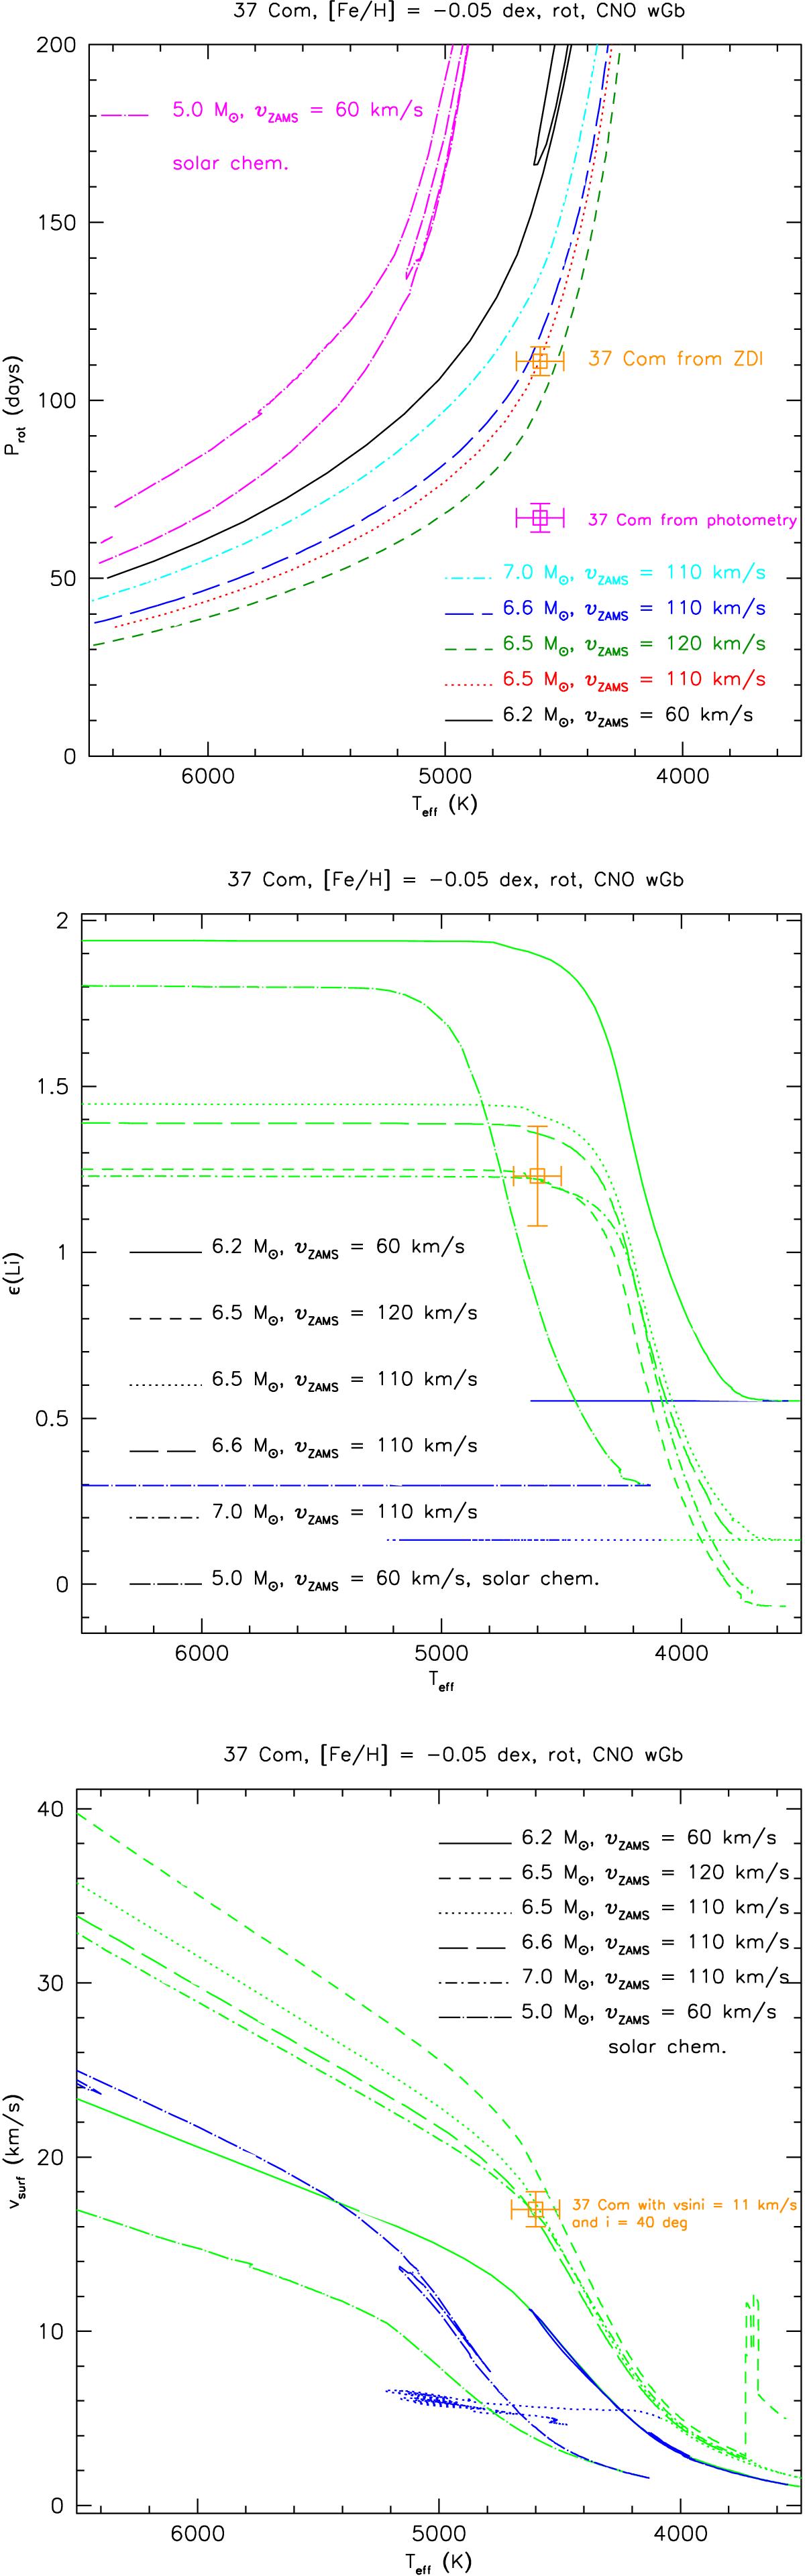
Evolution as a function of Teff for Prot, ϵ(Li) and vsurf for some models described in Table 5, as labeled on the plots. The position of 37 Com is reported on each panel. Its lithium abundance is that determined in the present study: A(Li) = 1.23 ± 0.15. The error bar on the effective temperature is about 100 K. In the upper panel, we also show the photometric period, which is not compatible with the other indicators, contrary to the one derived from ZDI and adopted in the present study. In the middle and lower panels, the colours are the same as in Fig. 8.
Current usage metrics show cumulative count of Article Views (full-text article views including HTML views, PDF and ePub downloads, according to the available data) and Abstracts Views on Vision4Press platform.
Data correspond to usage on the plateform after 2015. The current usage metrics is available 48-96 hours after online publication and is updated daily on week days.
Initial download of the metrics may take a while.