Fig. 8
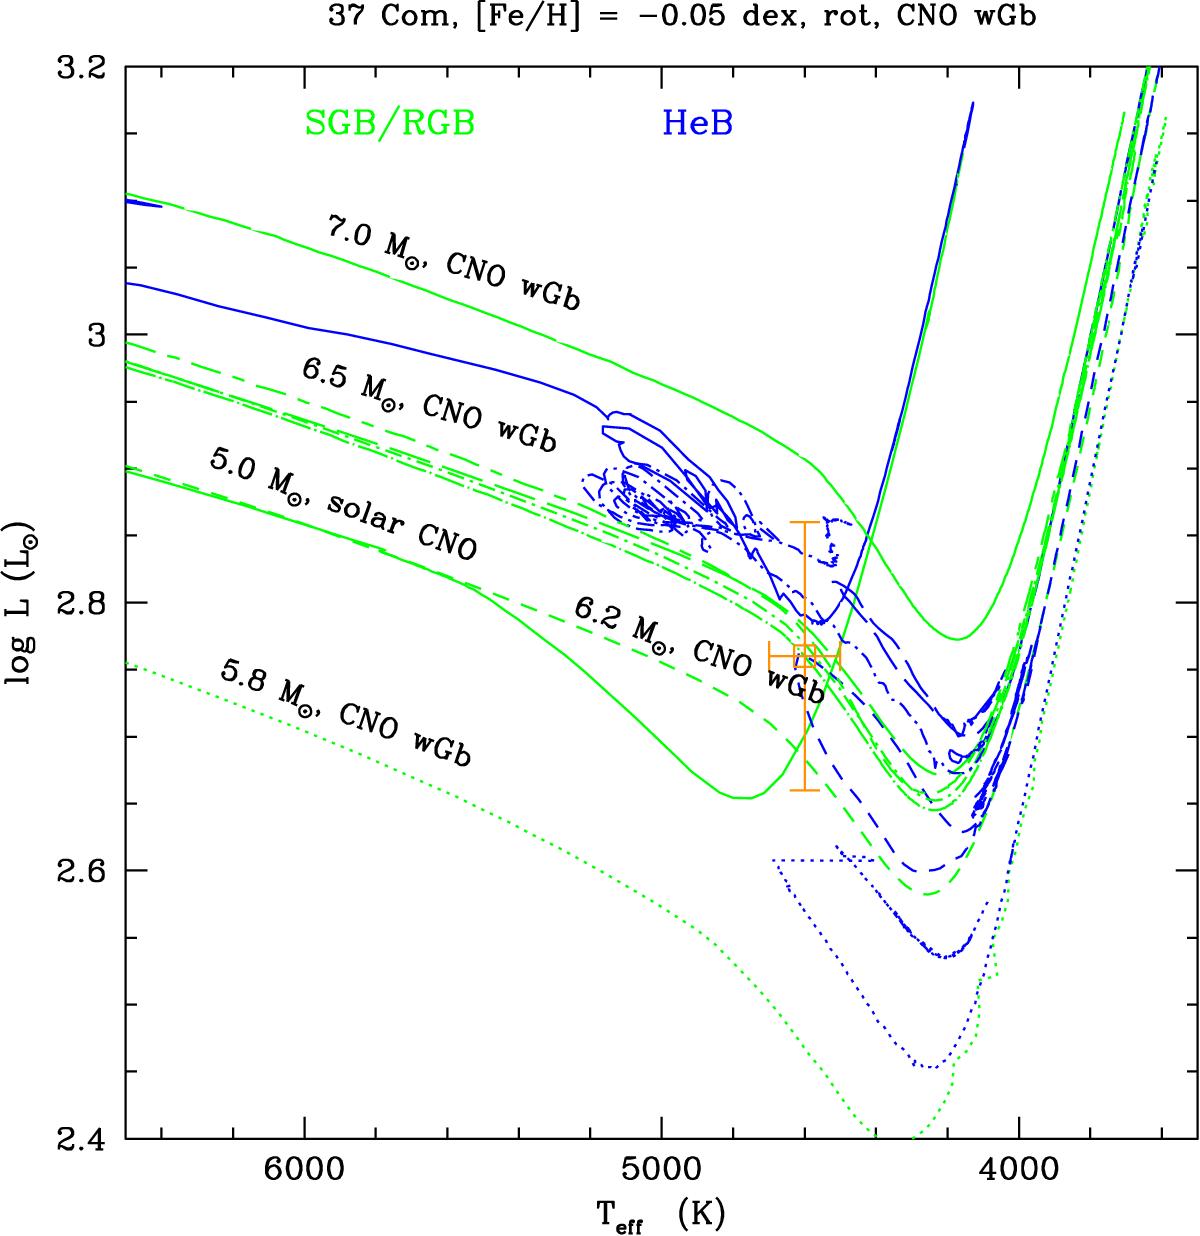
Hertzsprung-Russell diagram including the position of 37 Com (using the latest version of Hipparcos parallaxes) and the rotating stellar evolution models described in Table 5 and labeled on the figure. The label 6.5 M⊙, CNO wGb refers to the set of 4 tracks shown in broken lines right below the label, each of them computed with a different rotational velocity on the ZAMS: 60 km s-1, 80 km s-1, 110 km s-1 and 120 km s-1. The 5 M⊙ model with solar CNO abundances is the solid line in the middle of the plot. In the colour version of this figure, the green parts of the tracks correspond to the subgiant/red giant branch phases, and the blue parts are associated with the core He-burning phase.
Current usage metrics show cumulative count of Article Views (full-text article views including HTML views, PDF and ePub downloads, according to the available data) and Abstracts Views on Vision4Press platform.
Data correspond to usage on the plateform after 2015. The current usage metrics is available 48-96 hours after online publication and is updated daily on week days.
Initial download of the metrics may take a while.