Free Access
Fig. 7
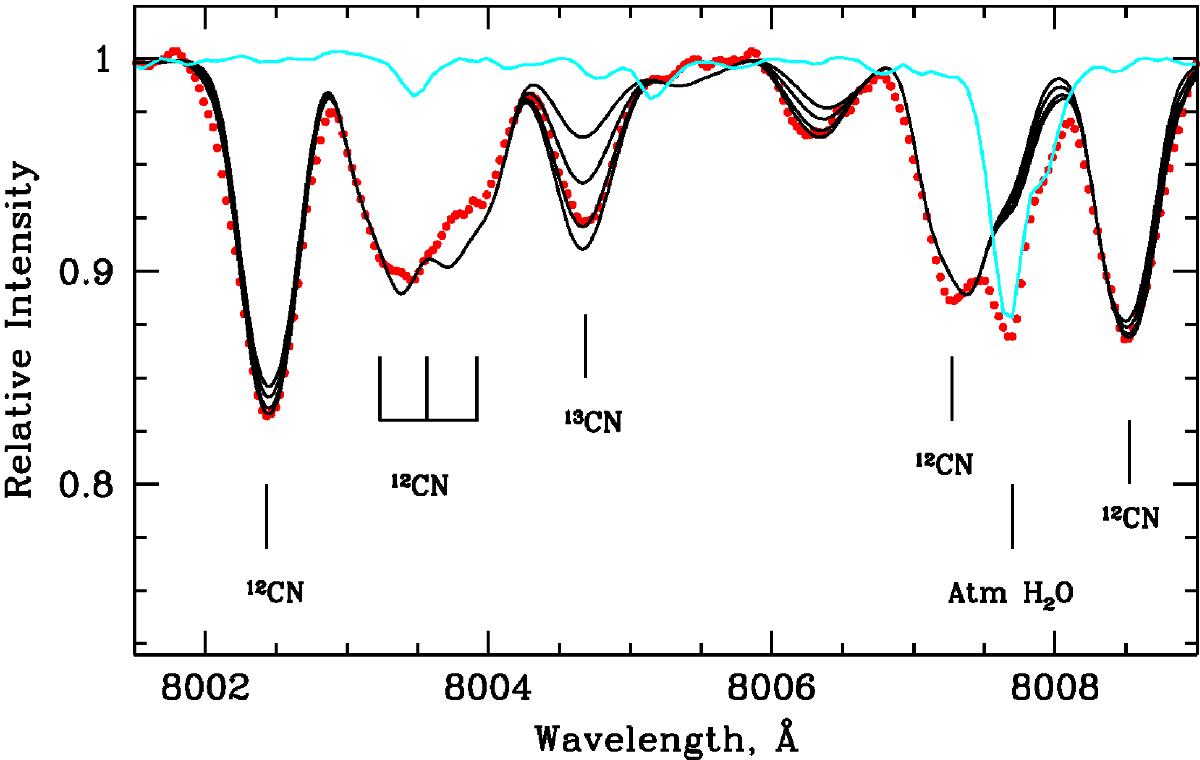
Observed (dotted red line) and synthetic (solid lines) spectra in the region around the 12CN and 13CN lines at ~ λ8004 Å. Synthetic spectra were calculated for four 12C/13C ratios, 3.6, 4.2, 6.0, and 10.0. The light blue solid line shows the spectrum of a hot star used to map the telluric H2O lines.
Current usage metrics show cumulative count of Article Views (full-text article views including HTML views, PDF and ePub downloads, according to the available data) and Abstracts Views on Vision4Press platform.
Data correspond to usage on the plateform after 2015. The current usage metrics is available 48-96 hours after online publication and is updated daily on week days.
Initial download of the metrics may take a while.