Fig. 4
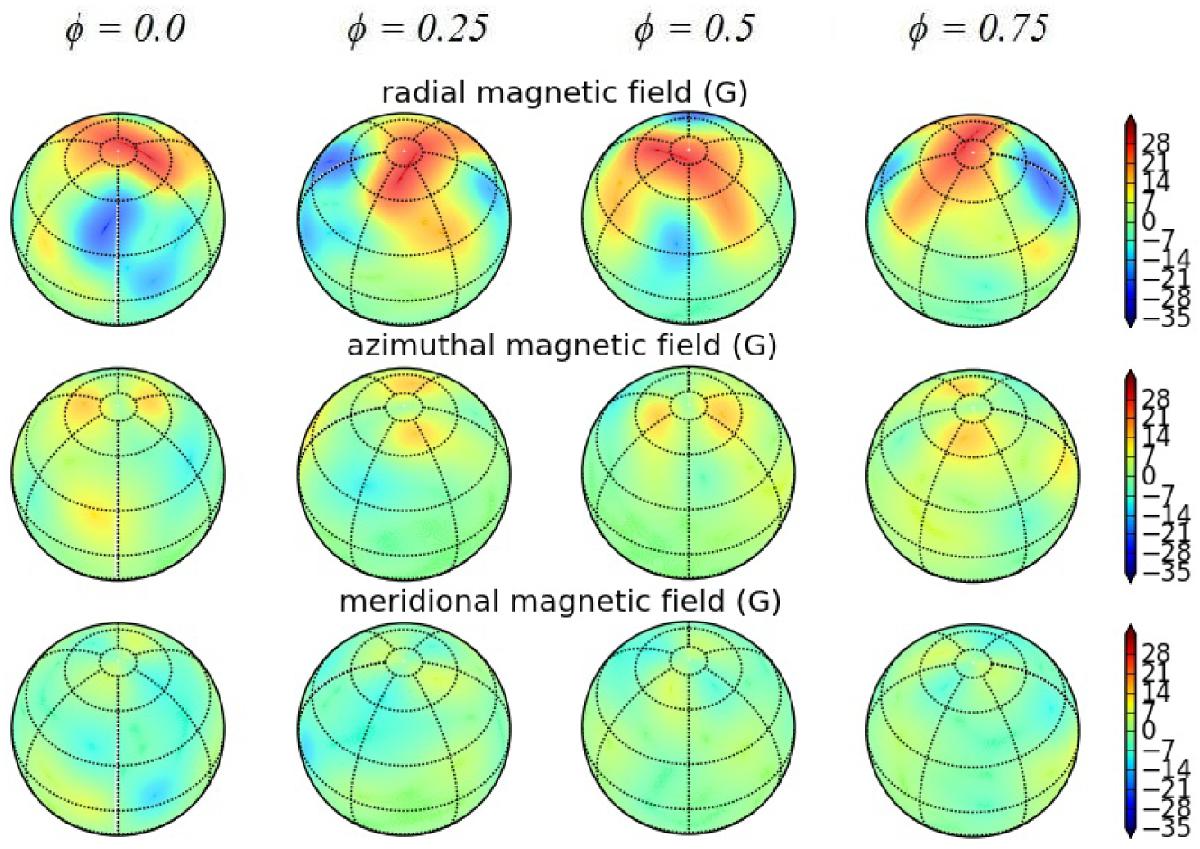
The magnetic map of 37 Com in the period from January 2010 to February 2011, derived from Stokes I and V profiles. The three rows illustrate the field components in spherical coordinates (from top to bottom – radial, azimuthal, meridional). The four columns correspond to four rotational phases, which are indicated at the top of the figure. The magnetic field strength is expressed in Gauss.
Current usage metrics show cumulative count of Article Views (full-text article views including HTML views, PDF and ePub downloads, according to the available data) and Abstracts Views on Vision4Press platform.
Data correspond to usage on the plateform after 2015. The current usage metrics is available 48-96 hours after online publication and is updated daily on week days.
Initial download of the metrics may take a while.