Fig. A.2
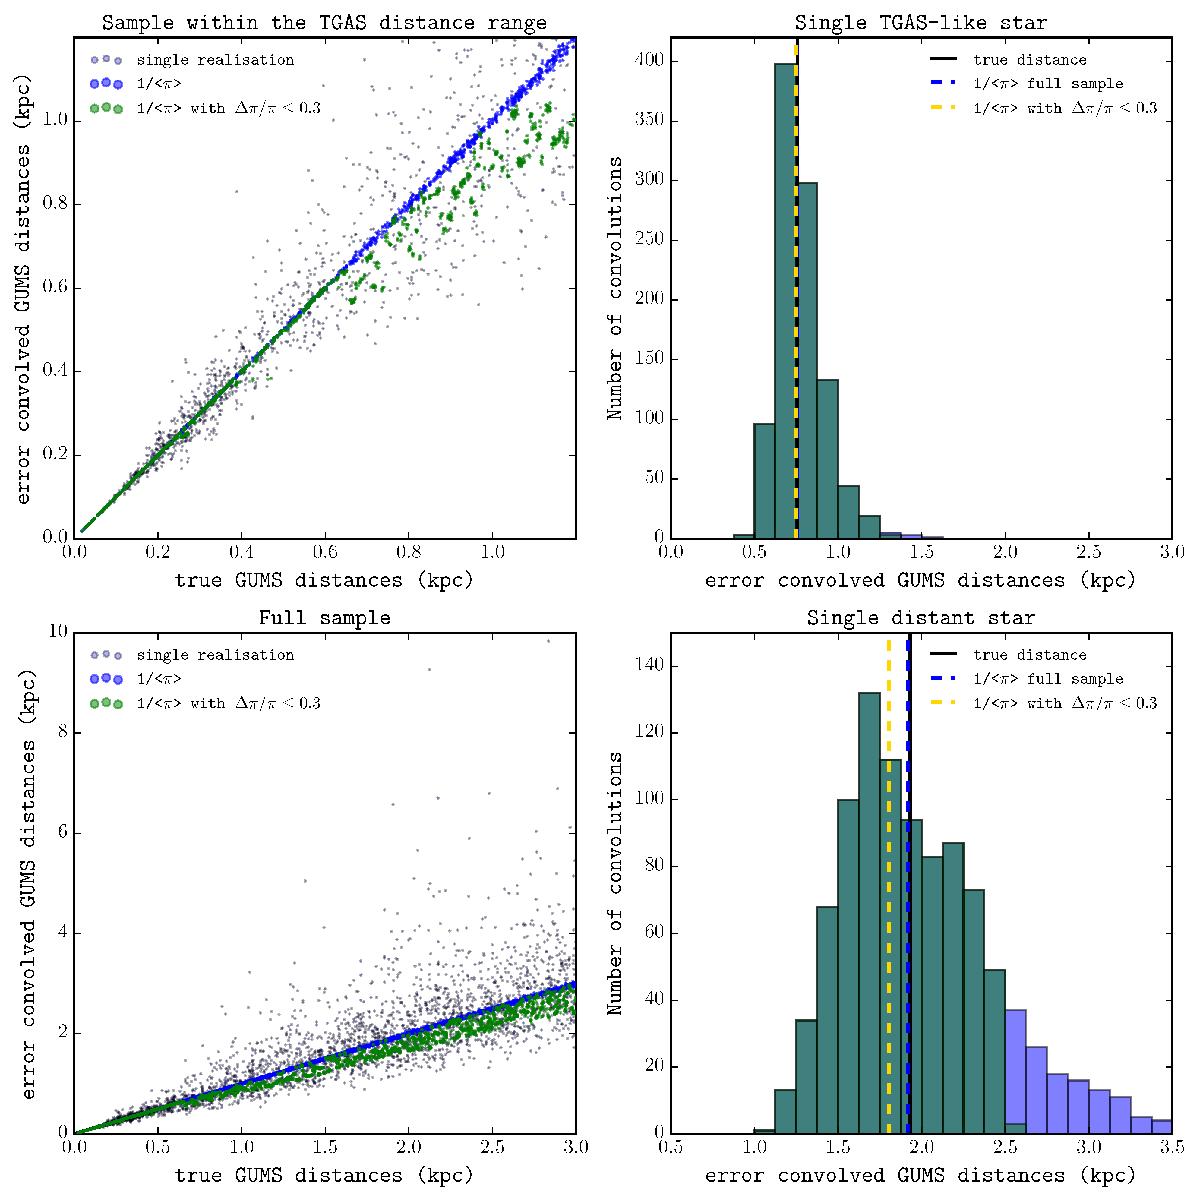
Left panels: true distances vs. a (random) set of error-convolved distances for a sample of halo stars from the Gaia Universe Model Snapshot. The top panels cover the distance range for the stars in our halo sample with parallaxes from TGAS, while the bottom panels do so for the full halo sample. The blue points in these panels represent the inverted average value of the parallaxes obtained from all 1000 convolved sets for each star, and they lie almost perfectly on the 1:1 line, while the green points are the averages obtained using only those realisations for which the relative parallax error is smaller than 30%. Right panels: distribution of distances from the 1000 error convolved parallaxes for a single star, at a distance of 0.75 kpc representative of a TGAS star (top), and at a distance of 1.9 kpc for a more distant object (bottom). One can see that the true distance to the star (solid vertical line) matches the distance obtained by inverting the parallax (dashed vertical line) extremely well, and this, in fact, coincides well with the mean of the distance distribution.
Current usage metrics show cumulative count of Article Views (full-text article views including HTML views, PDF and ePub downloads, according to the available data) and Abstracts Views on Vision4Press platform.
Data correspond to usage on the plateform after 2015. The current usage metrics is available 48-96 hours after online publication and is updated daily on week days.
Initial download of the metrics may take a while.